XNAT System Monitoring
As an XNAT installation gets more users and studies, a proper systems architecture and appropriate tuning can get the most out of your hardware. At the same time, monitoring the performance of your XNAT installation helps you be more responsive to your user base's needs.
Here is a summary of the tools we recommend for monitoring your systems.
Munin
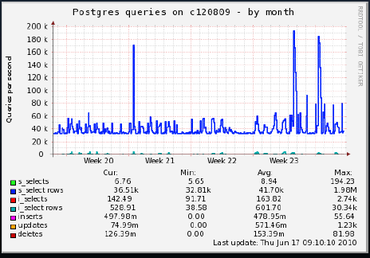
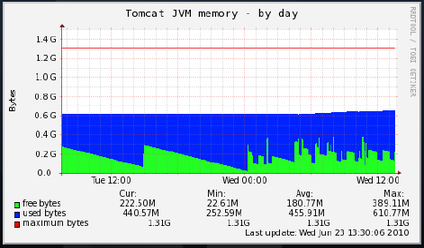
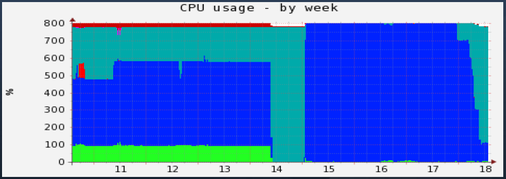
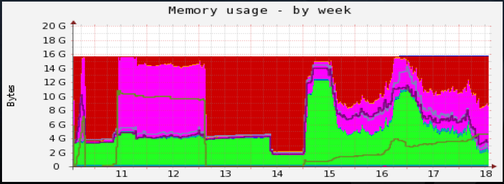
Munin allows you to monitor the performance of your backbone systems – PostgreSQL, Tomcat and Linux – over time. Track memory usage, CPU usage, queries and requests, among other things.
Example screenshots of Munin reports:
Monit
Monit provides monitoring & management of active processes, and allows you to define criteria for emailing alerts and/or restarting. For example, you might define a criteria around CPU usage, or reaching memory thresholds, or connection failures.
Pingdom
Developer: Pingdom / Solarwinds
License: Commercial
Cost: https://www.pingdom.com/pricing
Signup: https://www.pingdom.com/
Pingdom offers world-wide tests for site availability and response time, and offers SMS and email alerts when sites are unavailable. Example screenshots from Pingdom reports:

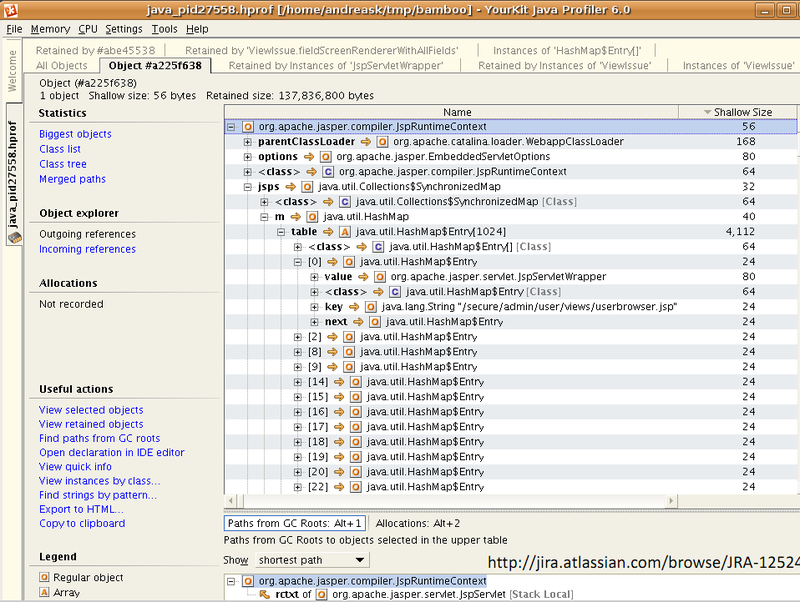
Yourkit Java Profiler
YourKit is an excellent tool for analyzing a Java process's memory and CPU usage. We have been able to significantly improve XNAT's speed and hunt down memory leaks by profiling with YourKit.
