
User Dashboard functionality included with the Batch Launch plugin provides users with the ability to monitor, inspect and terminate various workflow-associated processes in XNAT.
Users can access the dashboard via the icon near the search box.
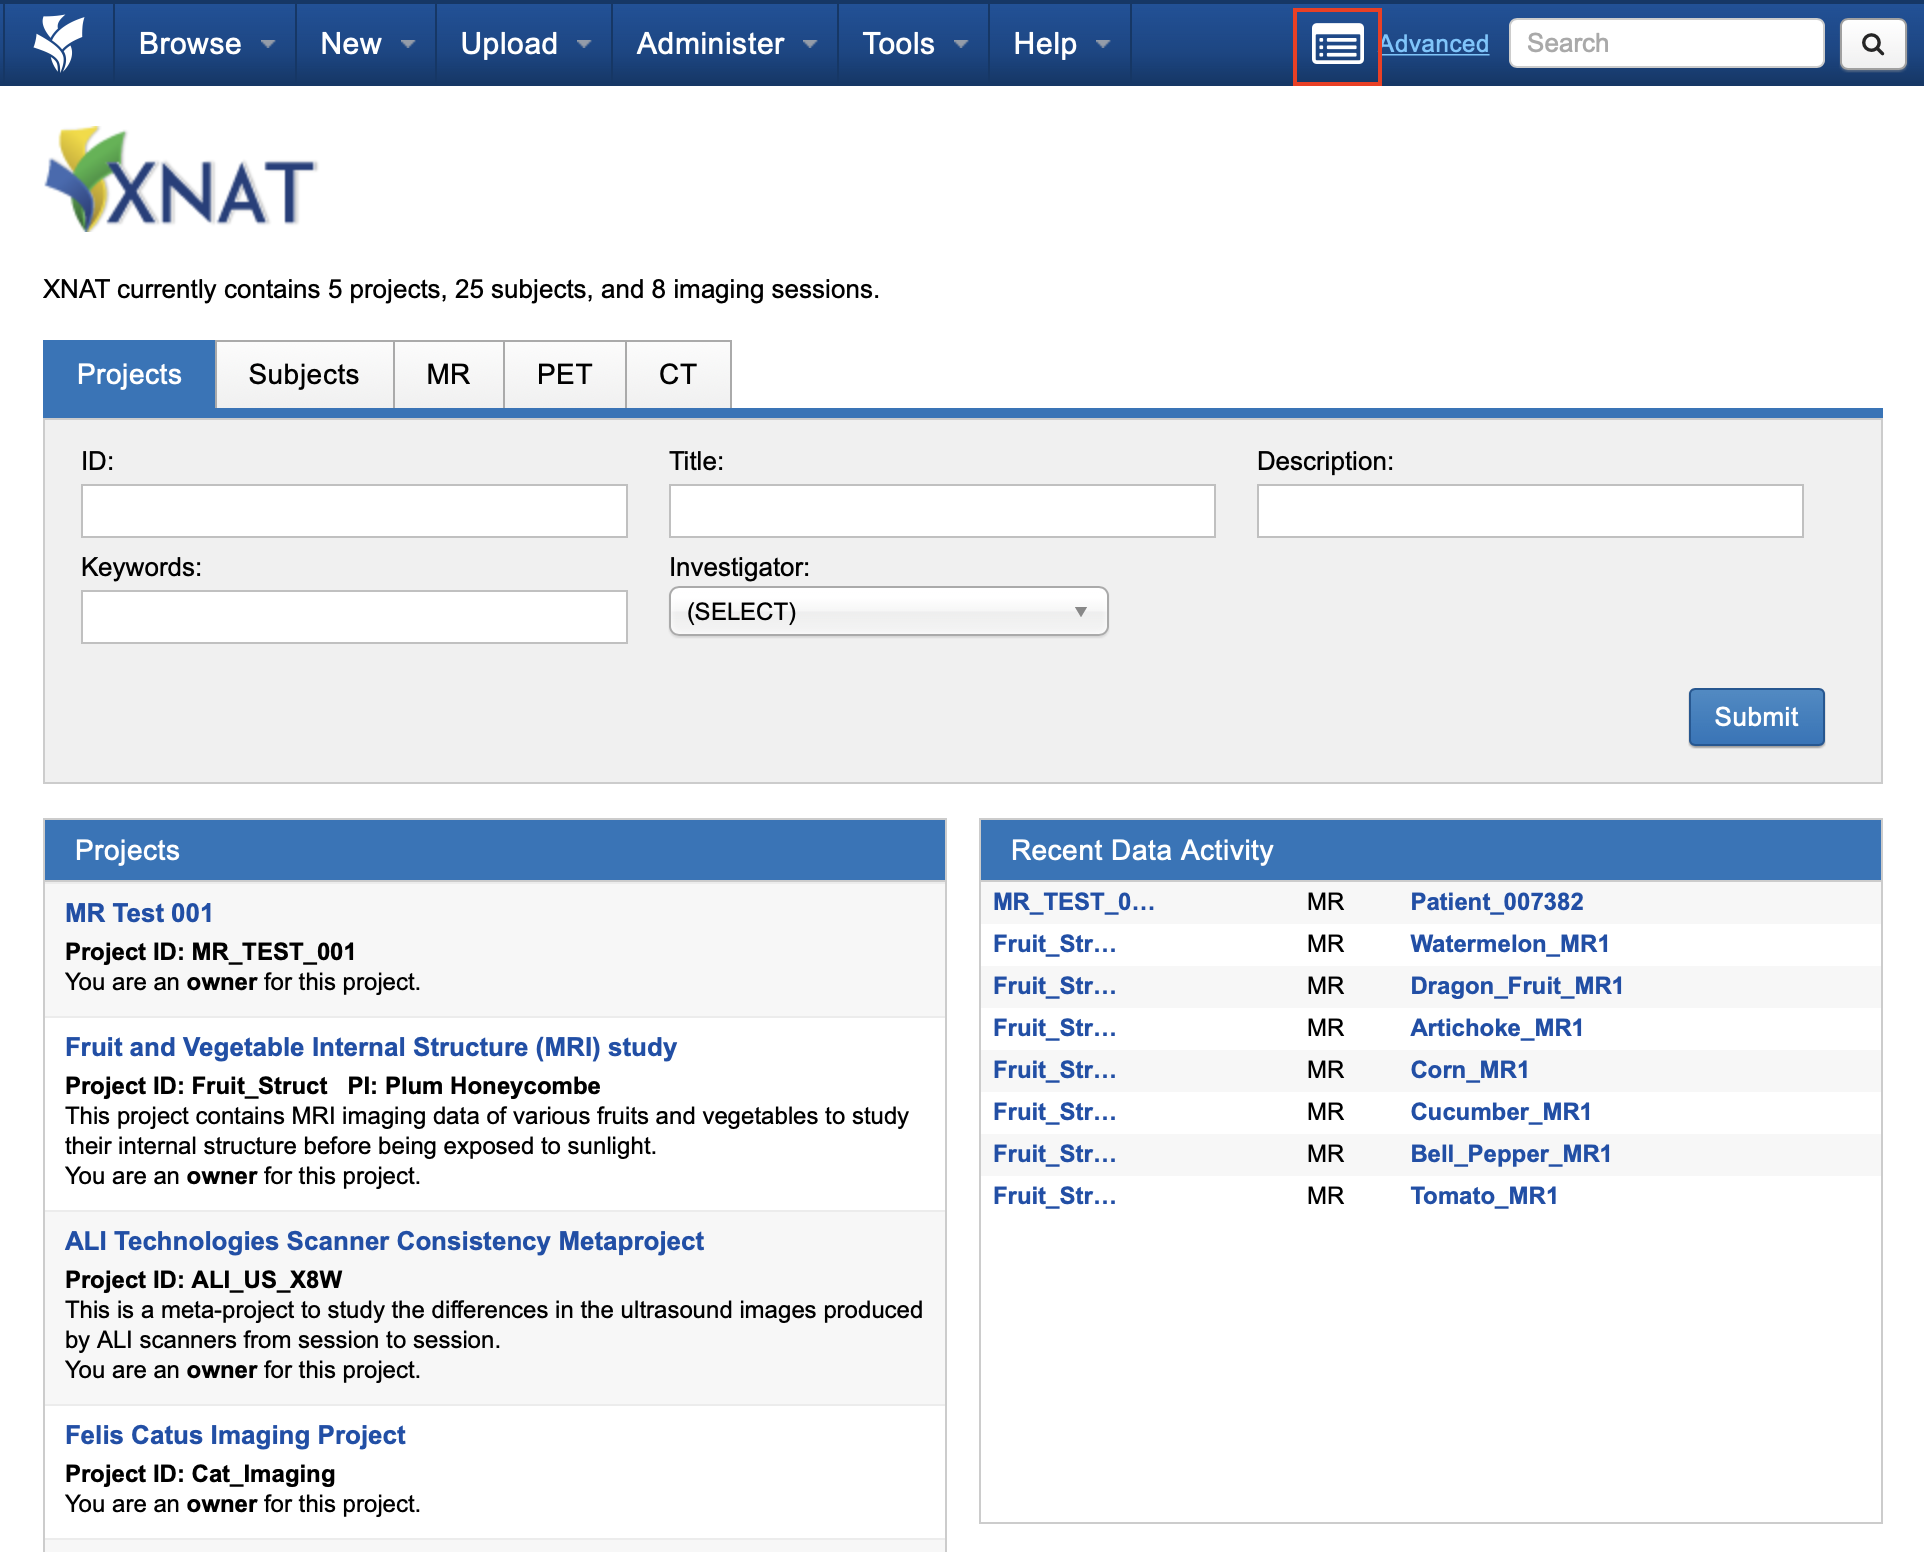
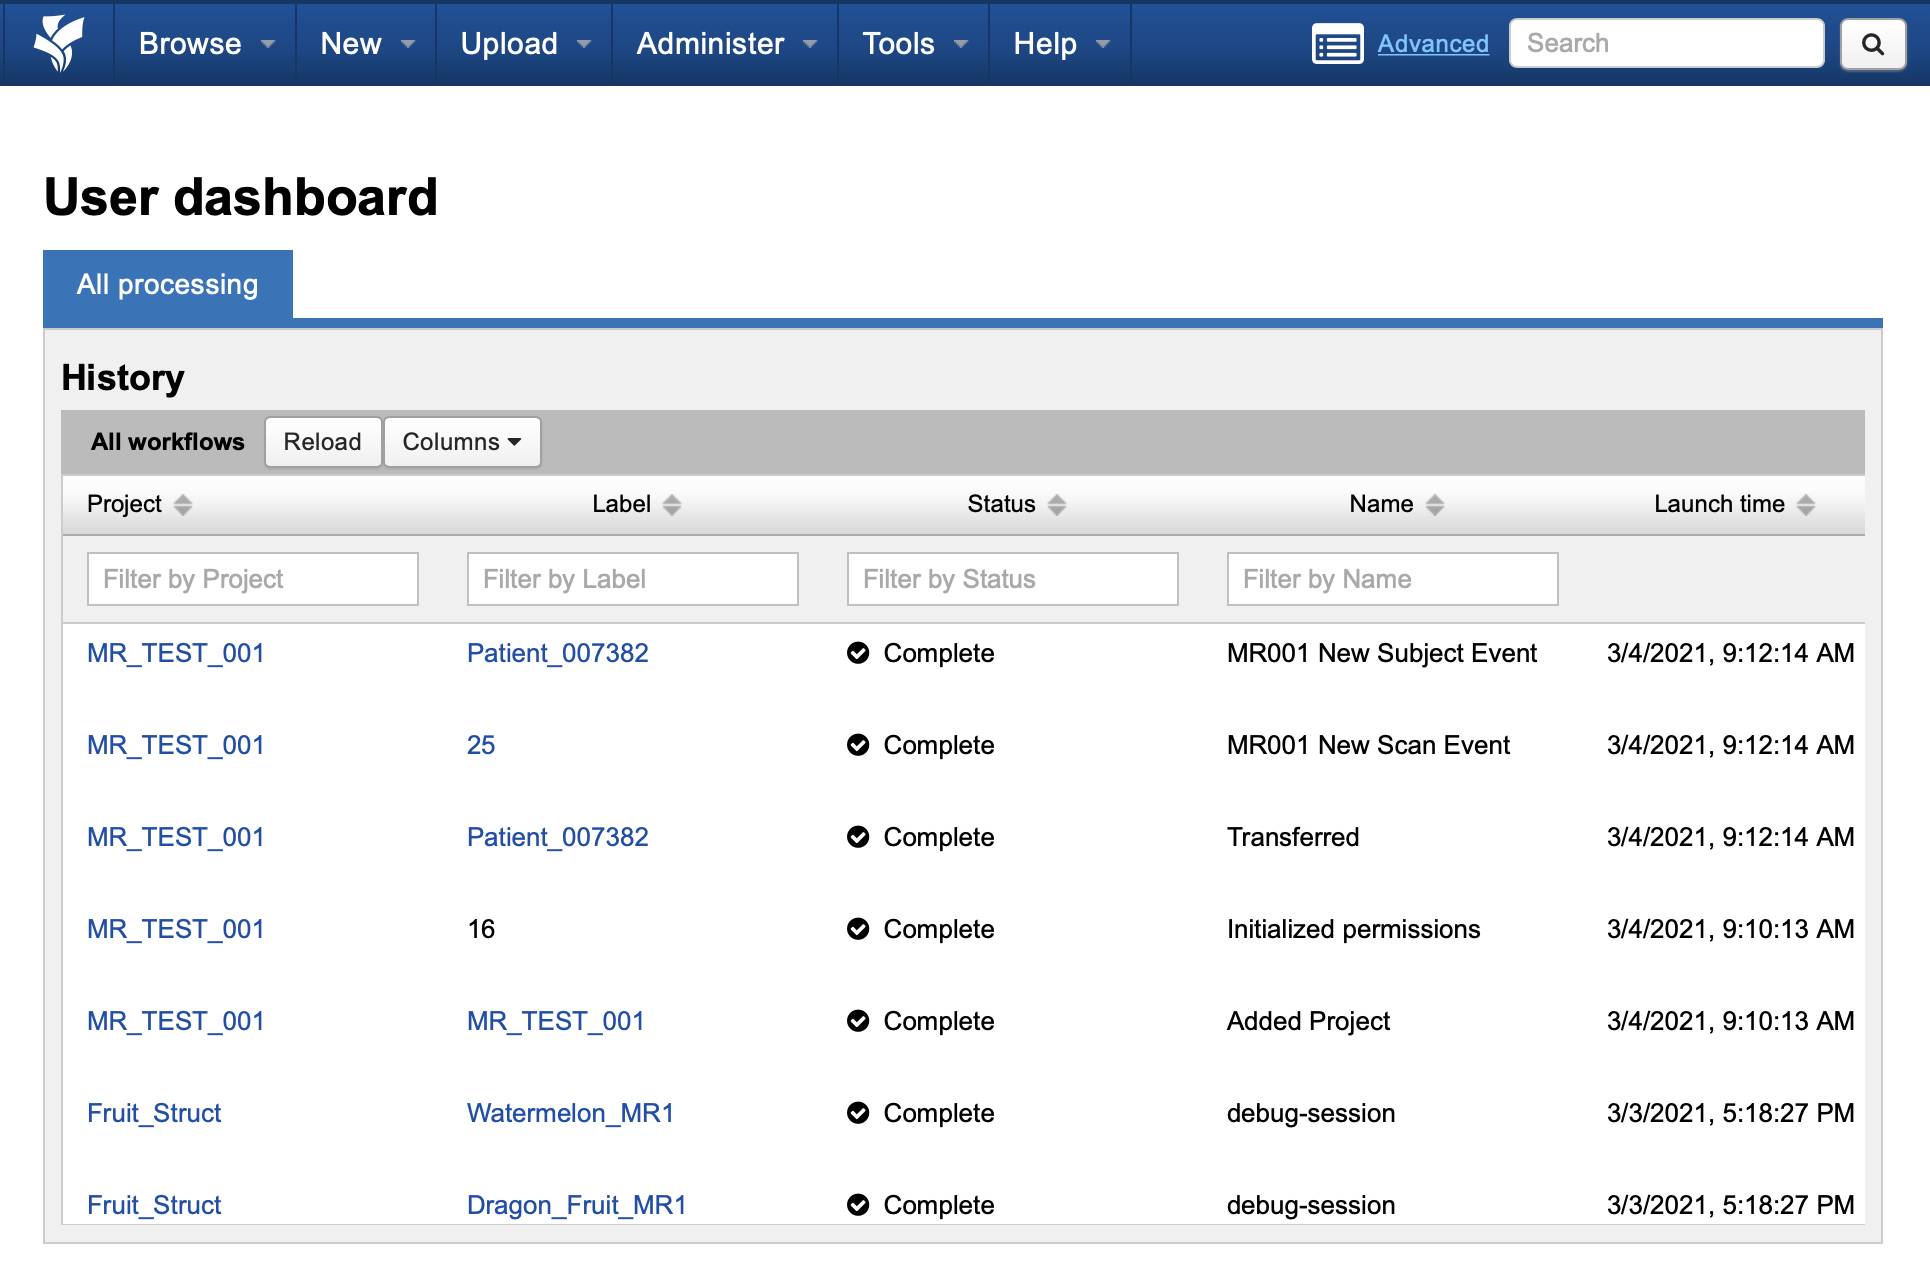
The User Dashboard shows workflow processes including XNAT archive operations, Event Service status, and Container Service processing state. Most users will see owned processes while XNAT Administrators will see all processes. The All Processing table provides column display customization, column filtering and sorting, as well as individual workflow element inspection.
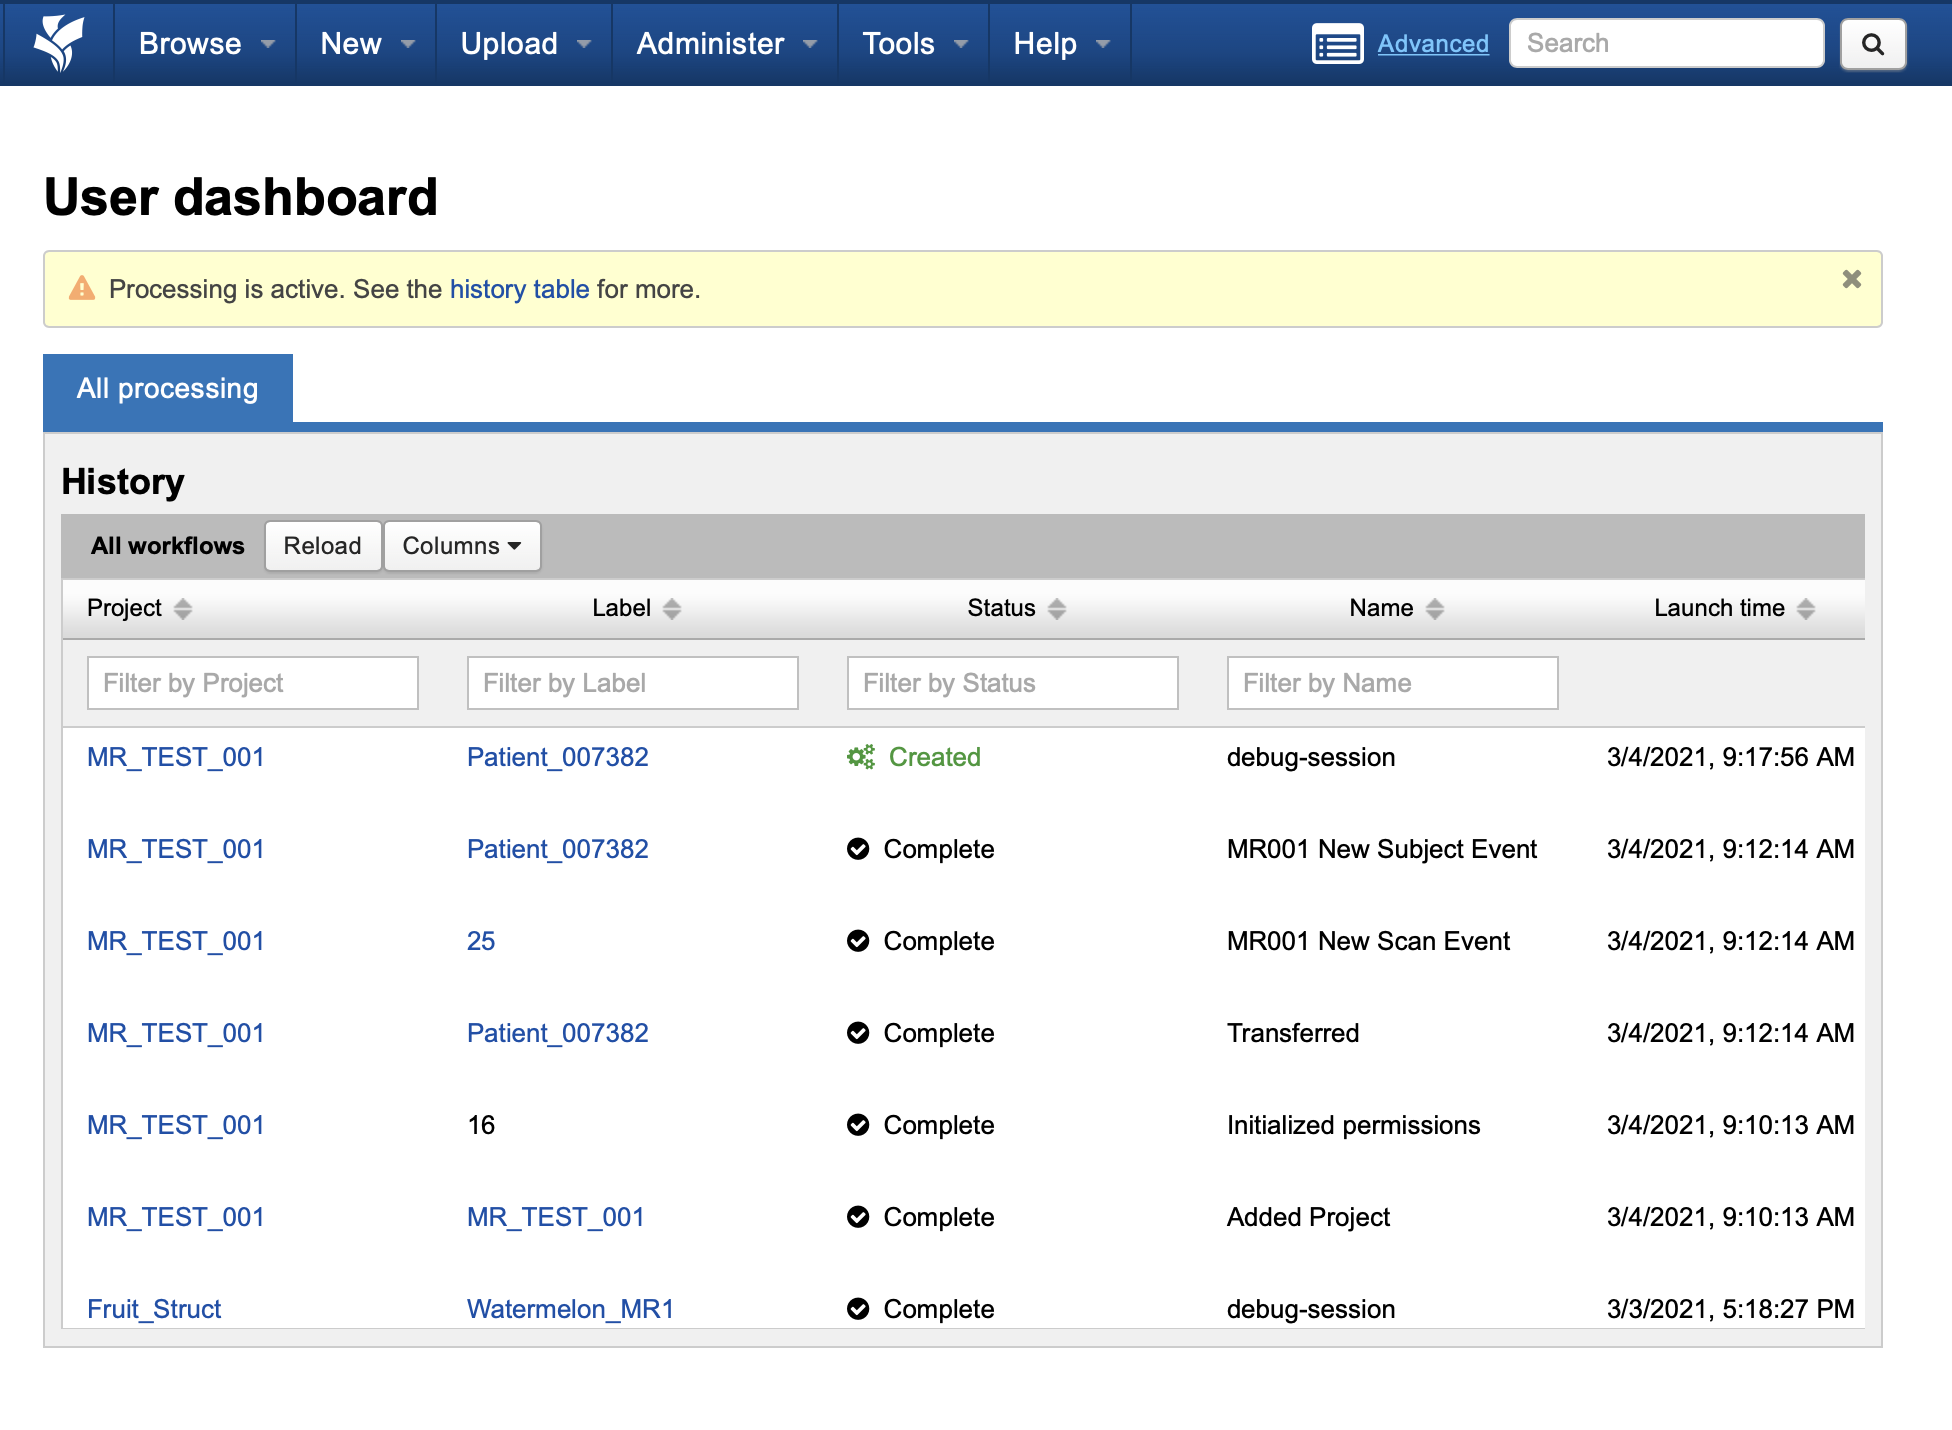
Workflow state is shown in the Status column. Here, the debug-session container is shown as being in the Created state.
Workflow status states can be refreshed using the All workflows Reload button or individually using the 
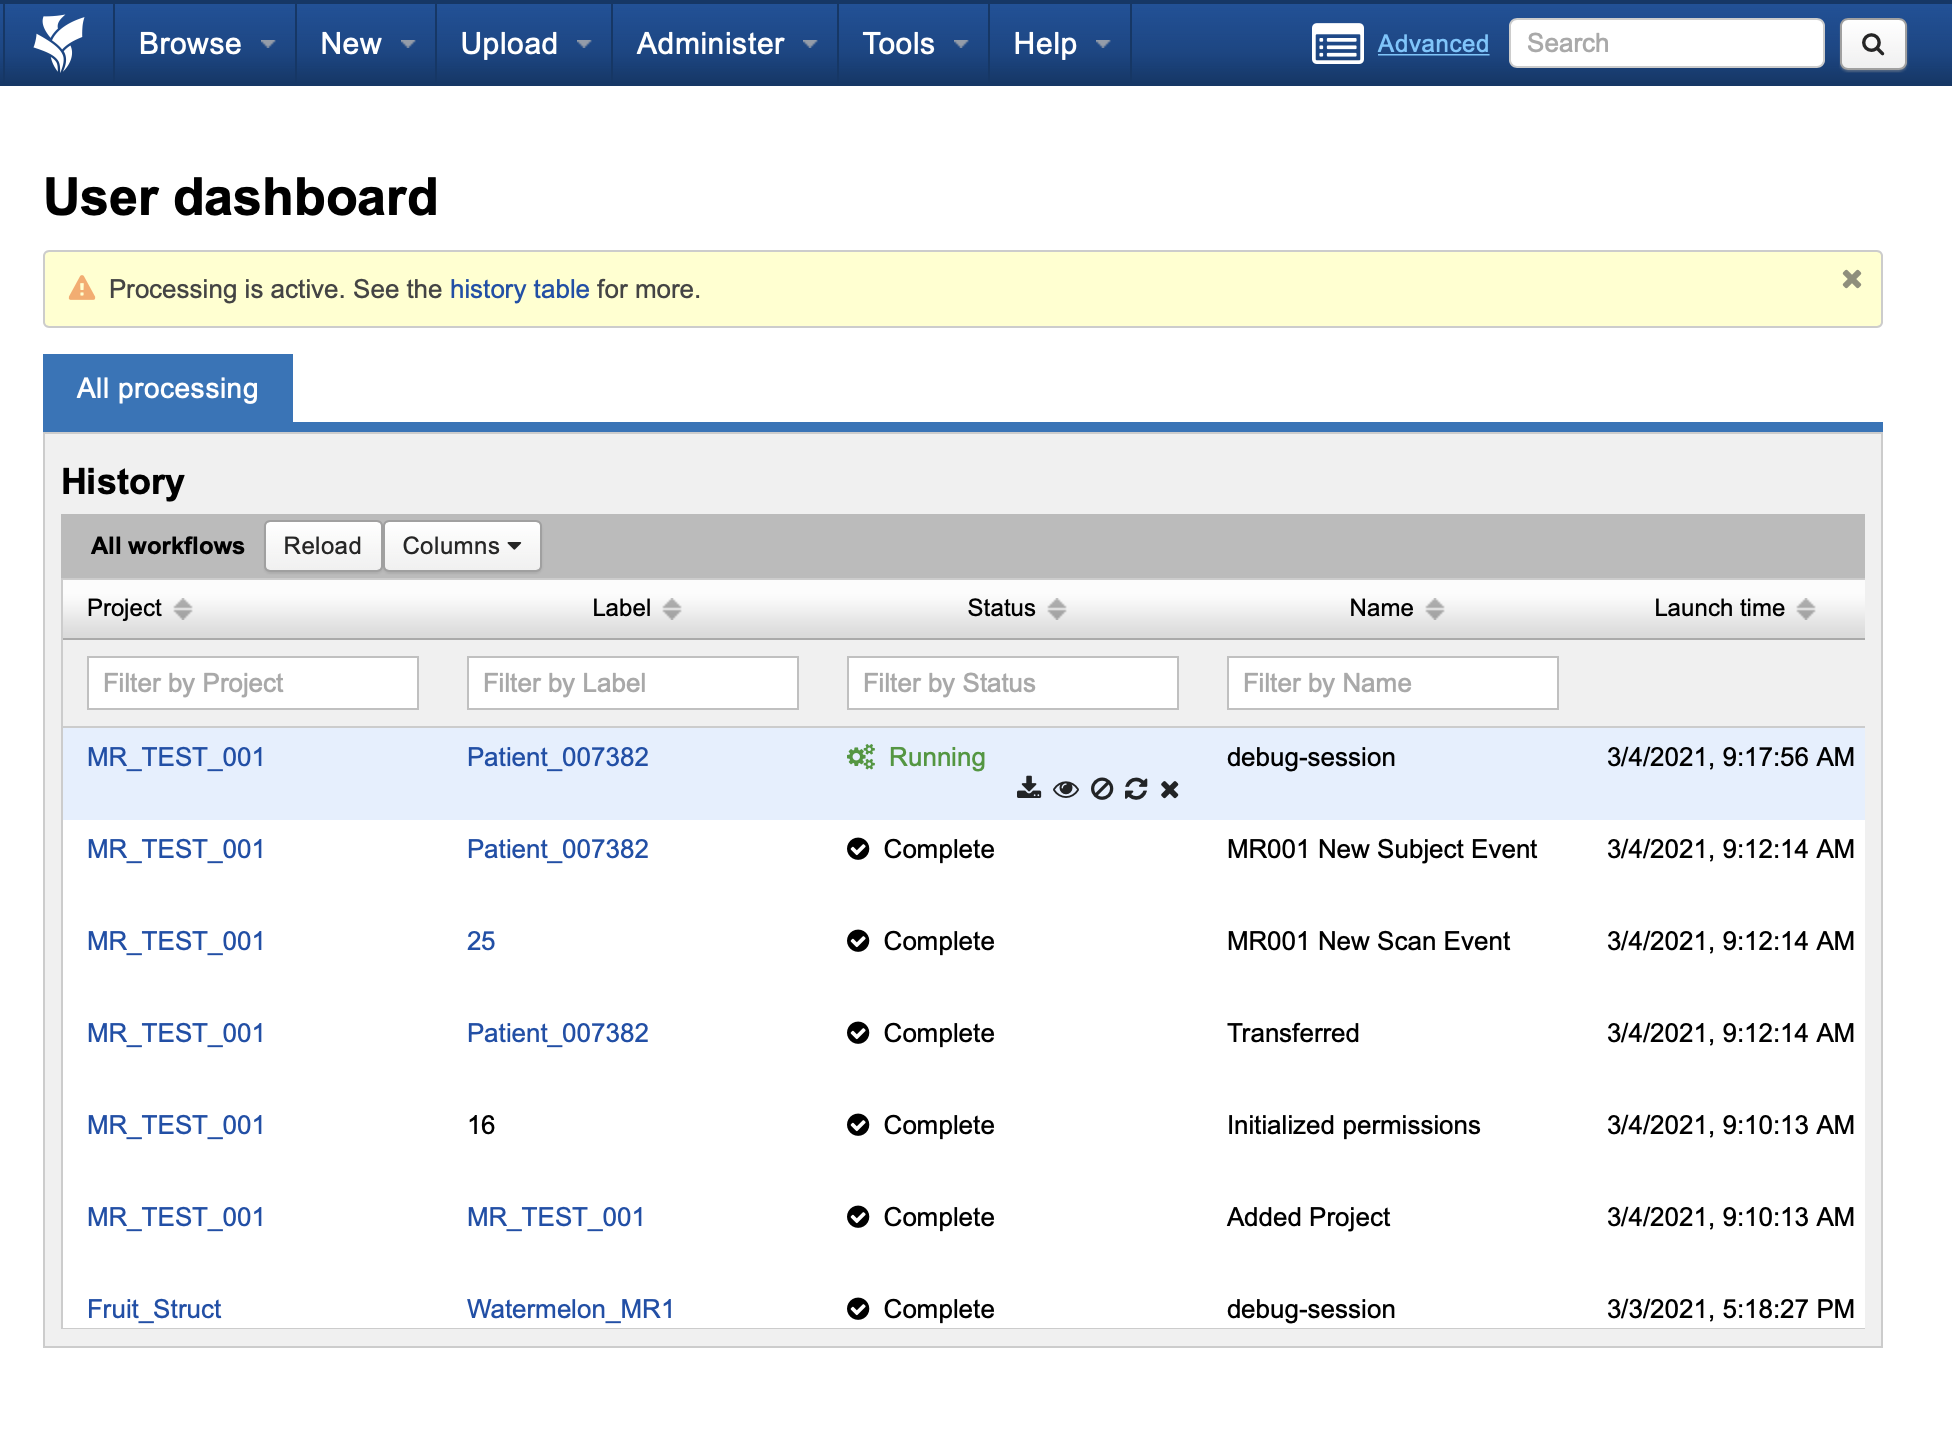
Other workflow action icons 
-

-

-

-
-
