Monitoring and Troubleshooting Pipelines
In XNAT version 1.9 onwards, the Pipeline Engine Framework now requires two components:
Please note that no changes are required to the means of specifying the PIPELINE_HOME value based on deploying the Pipeline Engine Plugin
As an XNAT Administrator, there are times when it is helpful to know what processes are running, who is running them, and if they have been running far longer than expected. This can both affect and be affected by overall system performance. It is also a good idea to ensure that any planned service interruptions are as minimally disruptive to your users' work as possible.
There are a few ways to monitor and track pipeline processing in XNAT.
Monitoring Pipeline and User Workflows in the Admin UI
Go to Administer > More > View All Workflows in the top navigation. This will display a very large data table consisting of every user workflow entry that XNAT has logged.
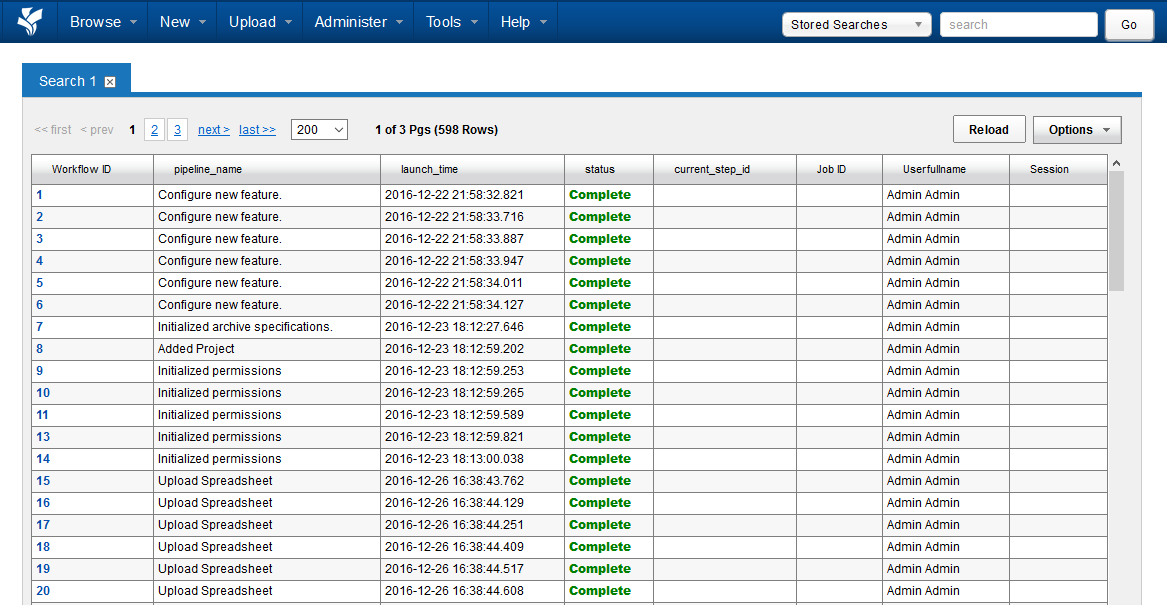
This data table is powered by a stored search that is automatically generated by XNAT. You can right-click on the pipeline_name column to set a filter for specific pipelines, and/or click on the Userfullname column to set a filter on a specific user. You can also save these modified data tables out as separate stored searches for future reference.
Any pipeline that is still running will have a status of "Running".
Monitoring All User Activity in the Admin UI
Go to Administer > More > Summary in the top navigation. This will display a modal with a series of usage reports in it. You can toggle the timeframe of these reports with the selectors at the top of the modal window.
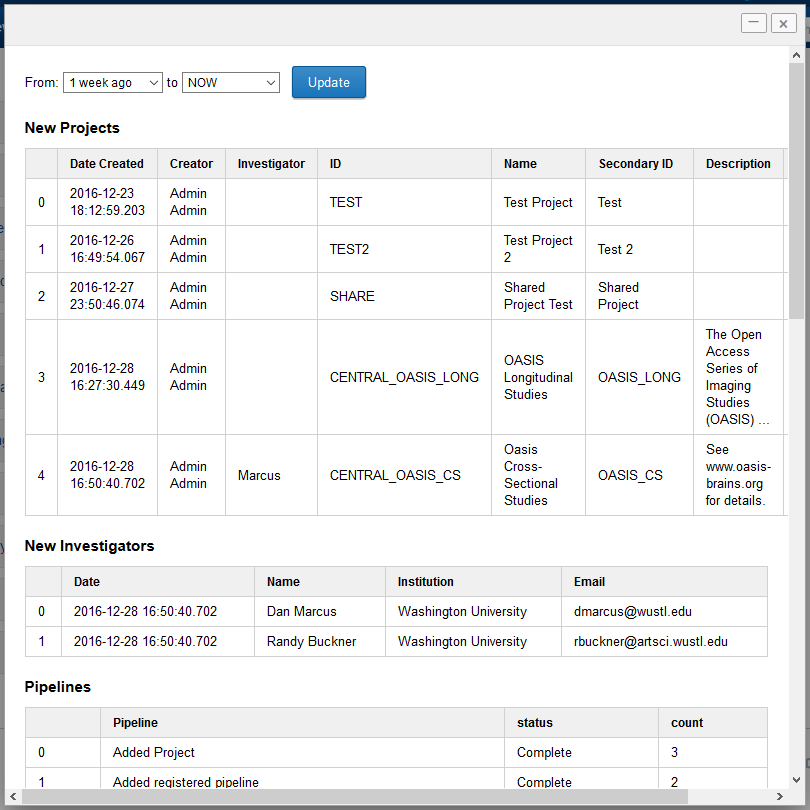
In this summary window, there is a summary of user workflows titled "Pipelines" that has a count of successful and failed runs.
Debugging Stalled or Failed Pipelines
From your command line, SSH into your XNAT and go to PIPELINE_HOME/logs. This directory contains timestamped log files which can be used to troubleshoot pipeline runs.
By default, PIPELINE_HOME is set to /data/xnat/pipeline.
Additionally, two files in the XNAT logs directory (XNAT_HOME/logs) may be useful in diagnosing pipeline issues: launch.log and pipeline.log.
By default, XNAT_HOME is set to /xnat/data/home. Therefore, your pipeline launch log files would be located at /data/xnat/home/logs/launch.log and /data/xnat/home/logs/pipeline.log
Any pipeline that is launched through XNAT will have its command line launch string added to launch.log, while pipeline.log only contains the launch string for failing pipeline executions. One important difference is that the (alias token secret) password for the admin account used to run the pipeline is hidden in the launch.log copy of the string. To figure out the cause of the pipeline failure, copy and run this statement from your ssh terminal as the tomcat user.
If your pipeline has stalled instead of failing, you may only have the password-less launch string in launch.log. If you need the full launch command, you can access the password for the alias token in the xhbm_alias_token database table.