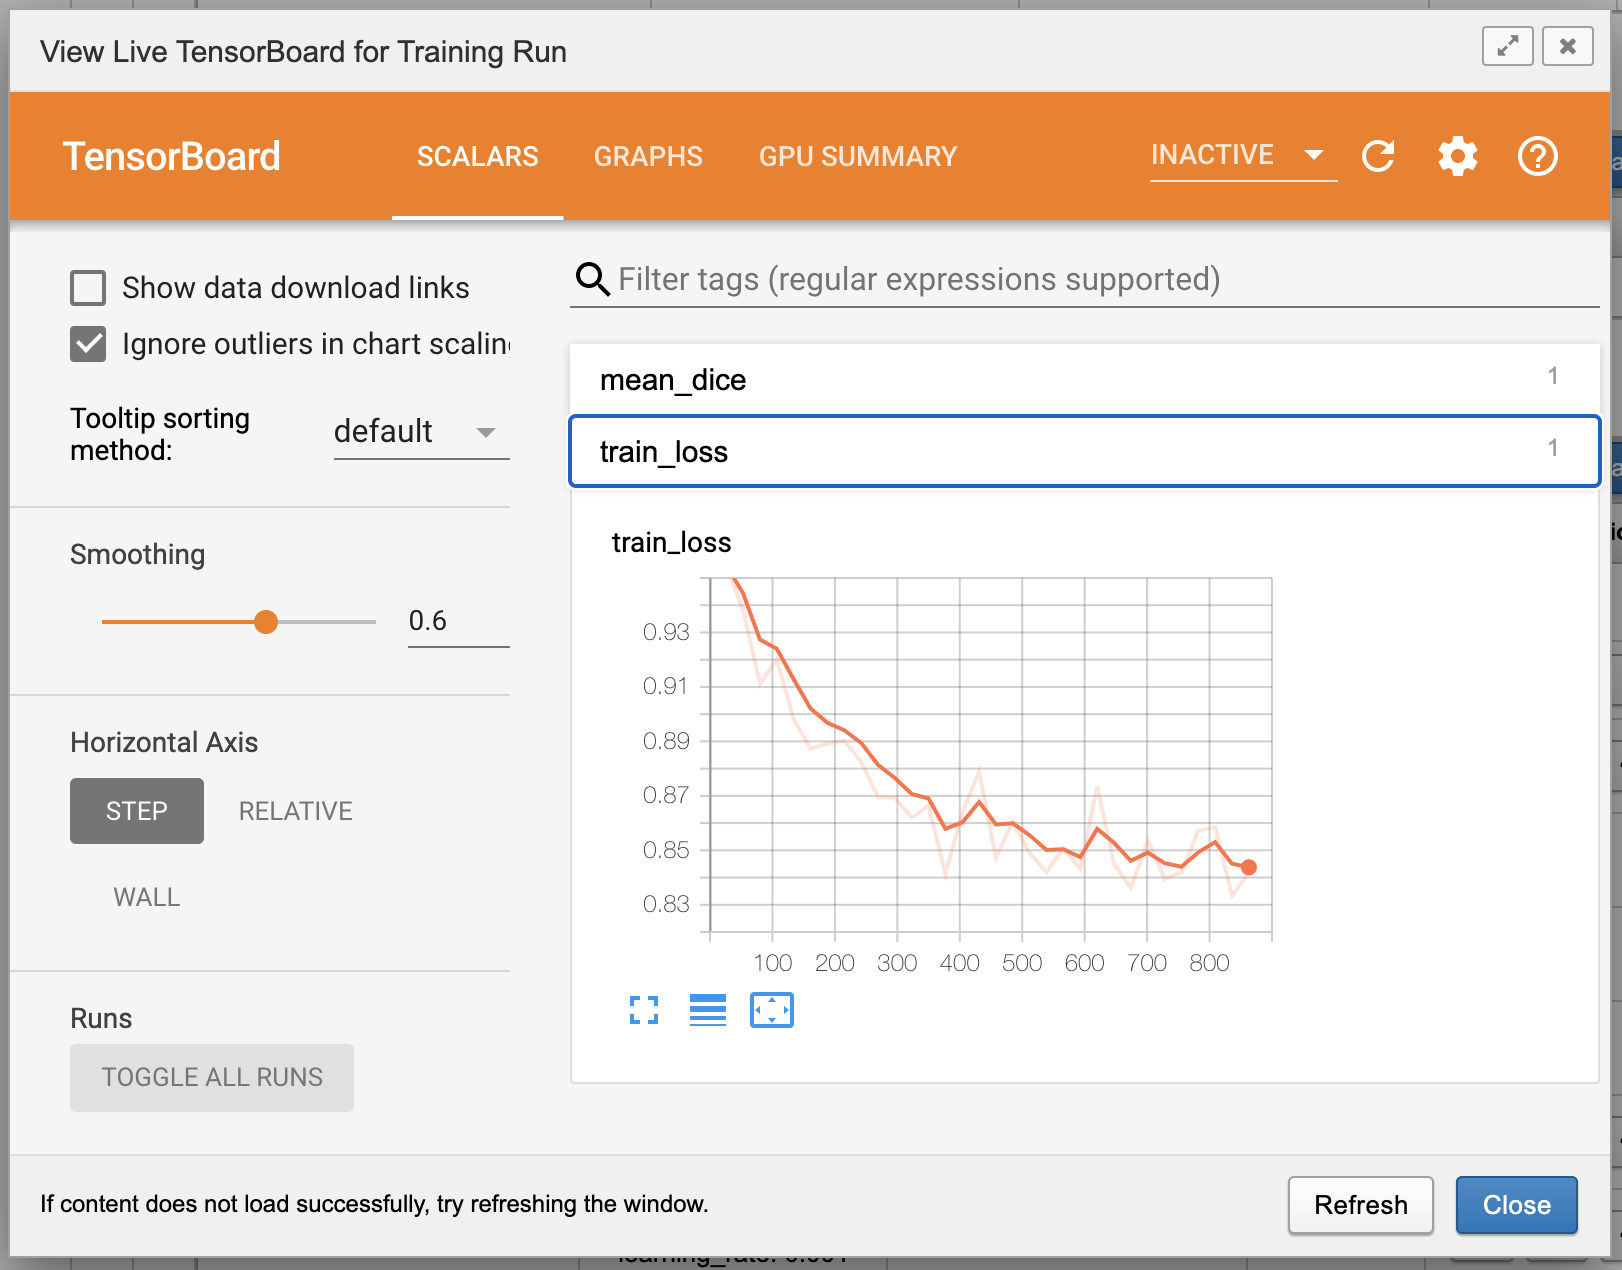
Viewing Training Progress in TensorBoard
In order for this functionality to work, you must have the Traefik proxy server configured and the xnat/demo-tensorboard container image installed. See Components of the XNAT ML Release for reference.
There are known limitations with this functionality – notably, only one TensorBoard view can be open at any one time, for all users on your site. This feature is very much still in Beta.
By default, this "View TensorBoard" functionality is disabled in the ML plugin. To enable the features on this page, configure your Traefix proxy and install the tensorboard command, then log in as an XNAT Administrator and go to Administer > Plugin Settings > XNAT ML Prefs to toggle this option on.
Once you have launched training, the Models and Training dashboard gives you an opportunity to view the live results of the ongoing training in TensorBoard. This view draws from the tf_events file as new events are logged to it as an output of model training. First, locate your training run in the model dashboard.

You'll notice that the availability and appearance of the Tensorboard icon (

You can click on the 