Using the Batch Launch Plugin with the Container Service
The Batch Launch Plugin includes the capacity to launch and monitor multiple containers across a set of subjects, sessions, or scans. Launching container processing on project data requires that an appropriate Container Service command be installed and enabled on the project of interest.
There are two ways to access the batch launch processing dashboard:
For project-specific launches, open the Processing Dashboard from the Actions box on the Project report page, or from the Options of a search table on the project report page
For running batches across multiple projects, open the Processing Dashboard from the Options of any search result table that spans multiple projects.
Using the Processing Dashboard within a Project
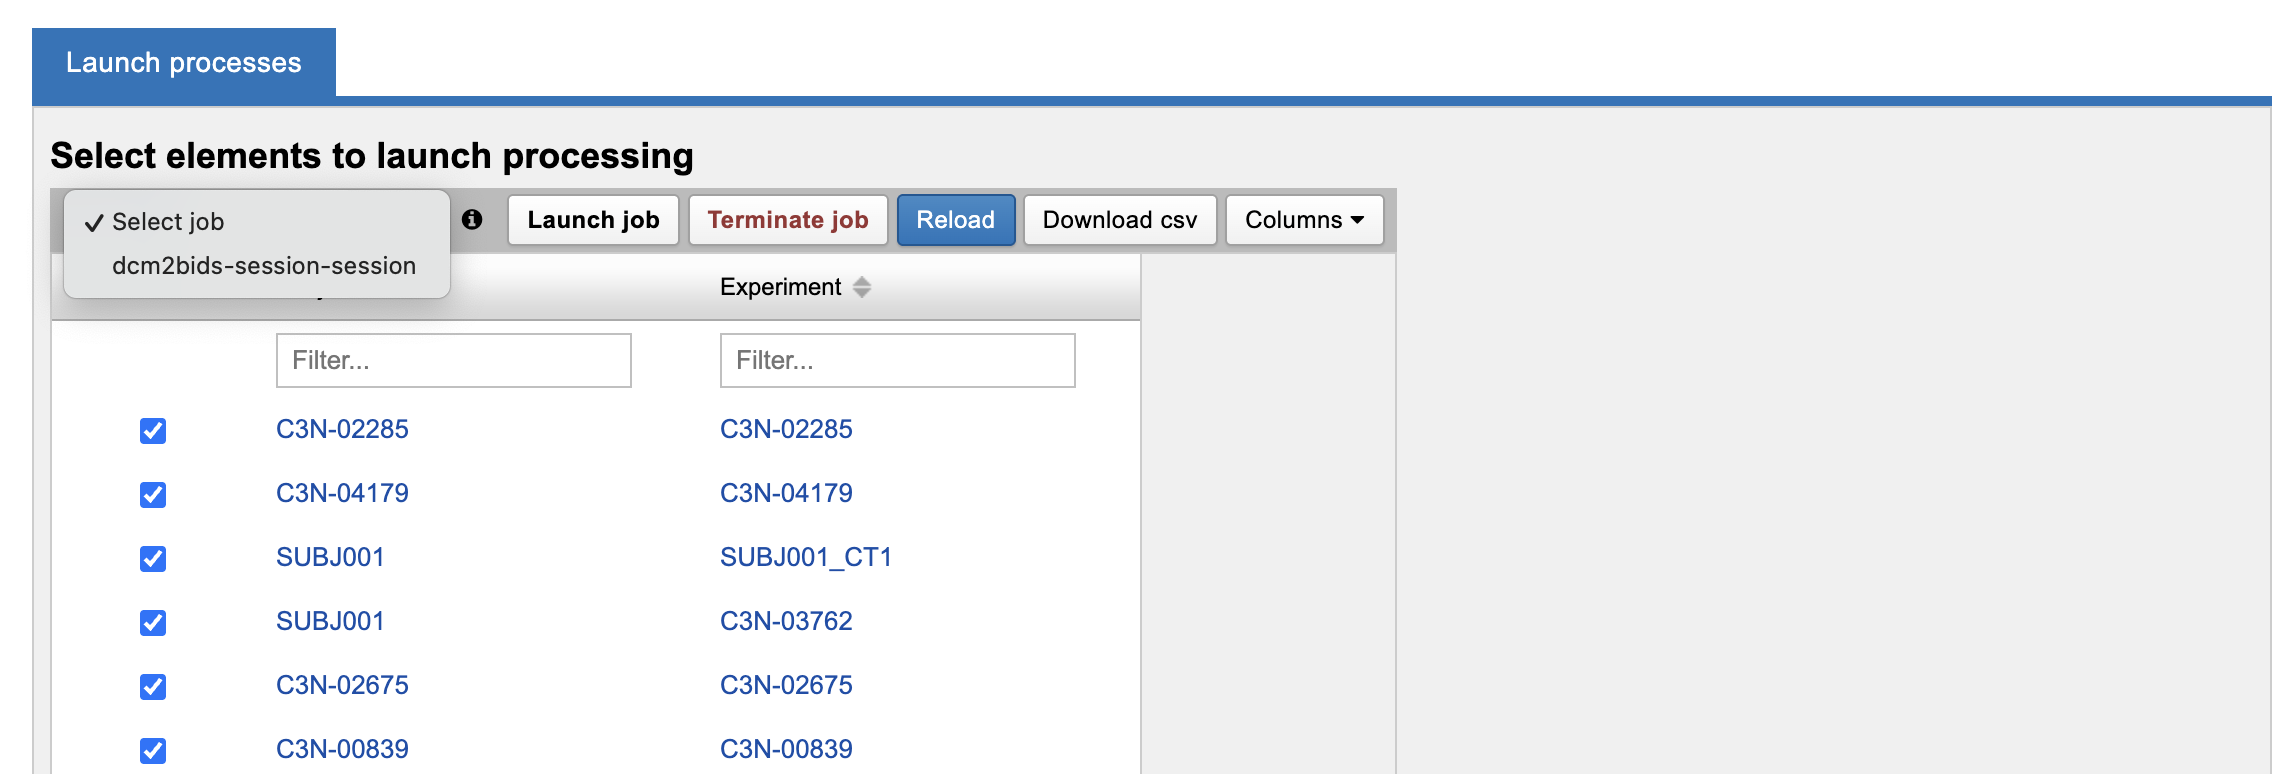
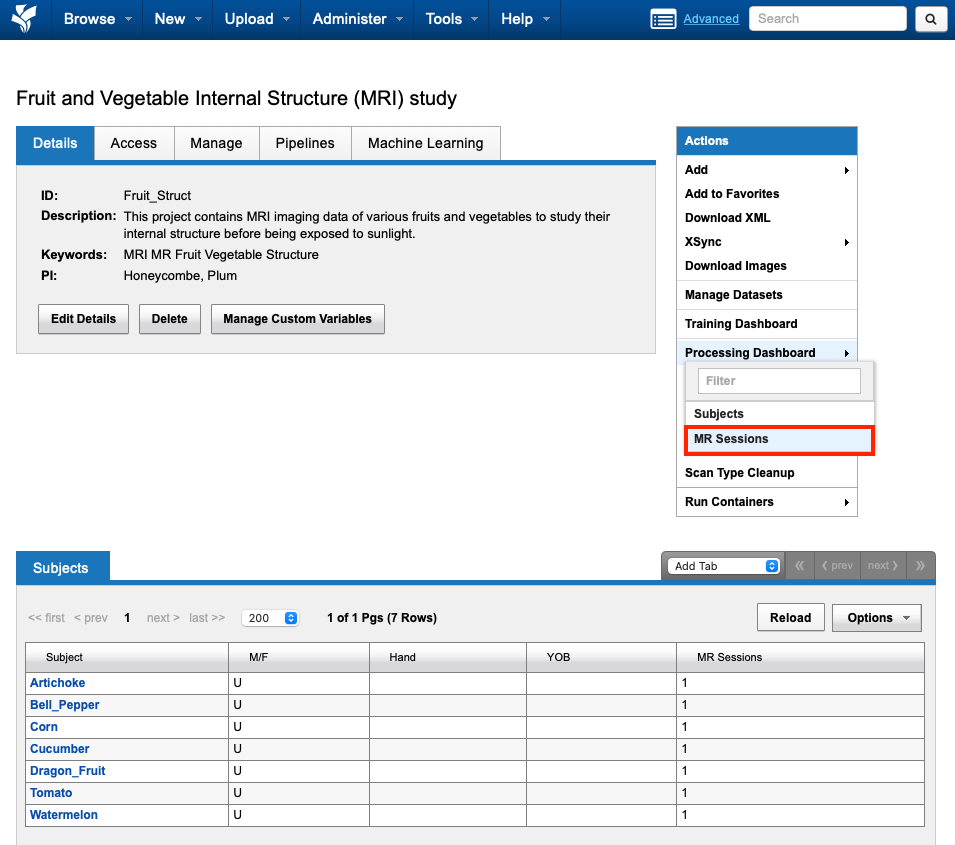
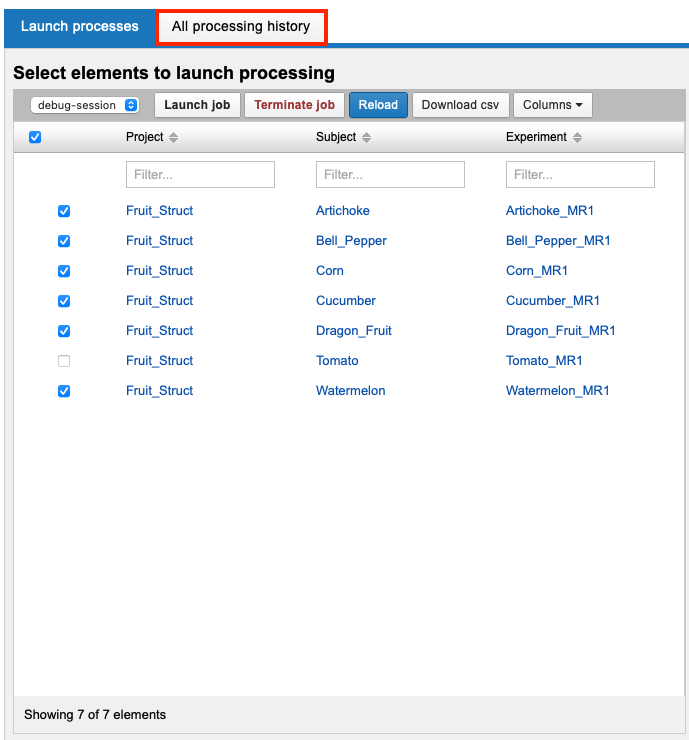
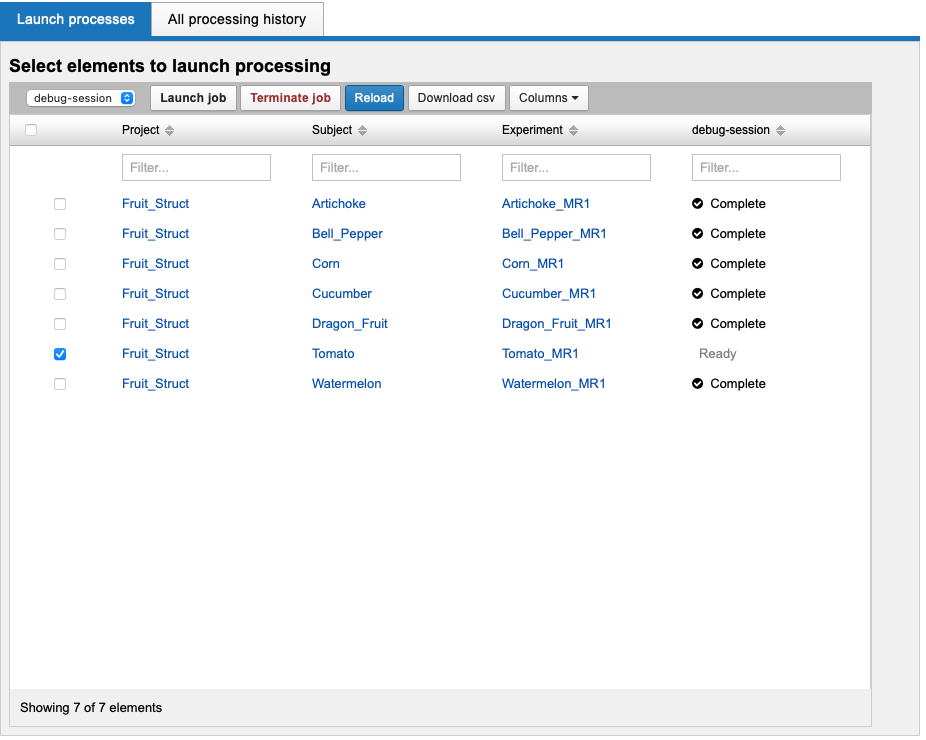
Access batch launch functionality under the Actions → Processing Dashboard menu on a project page. Select the parent XNAT datatype you wish to process. For example, select "MR Sessions".
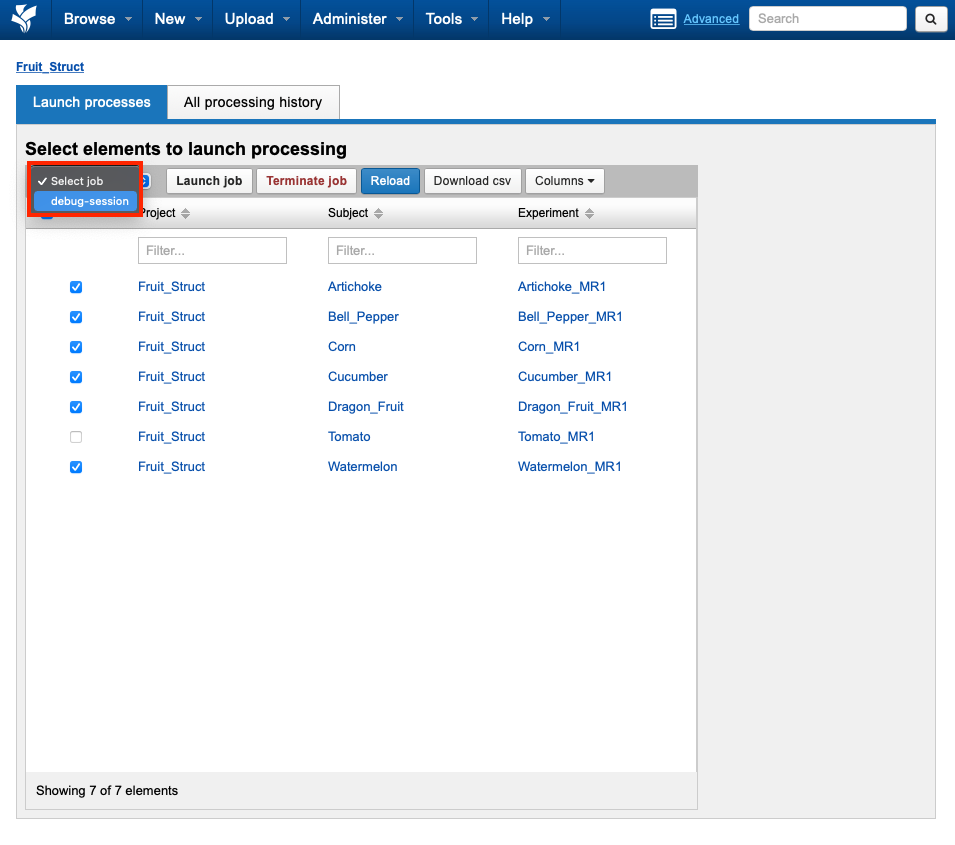
On the Processing Dashboard page, MR Session data are listed along with enabled Container Service commands that can run on image sessions. Please note that only commands that are enabled in your project will be shown.
As of XNAT 1.8.10 and Container Service 3.4.3, resource files from shared experiments can now be mounted into containers. However, project permissions issues still dictate whether containers can be run or data can be stored back to these shared data objects. See: Understanding Data Sharing in XNAT's Security Structure
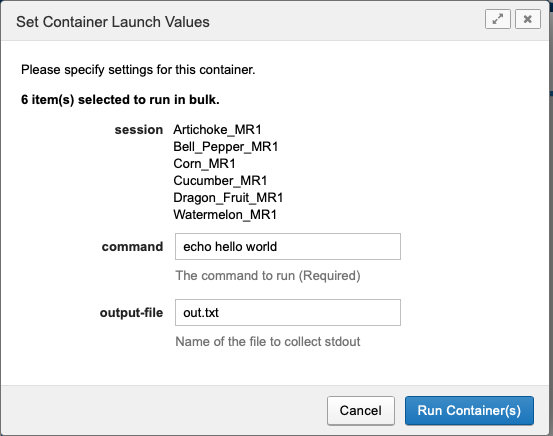
Choose an appropriate container command from the Select job menu and select sessions using select-all or individual checkboxes.
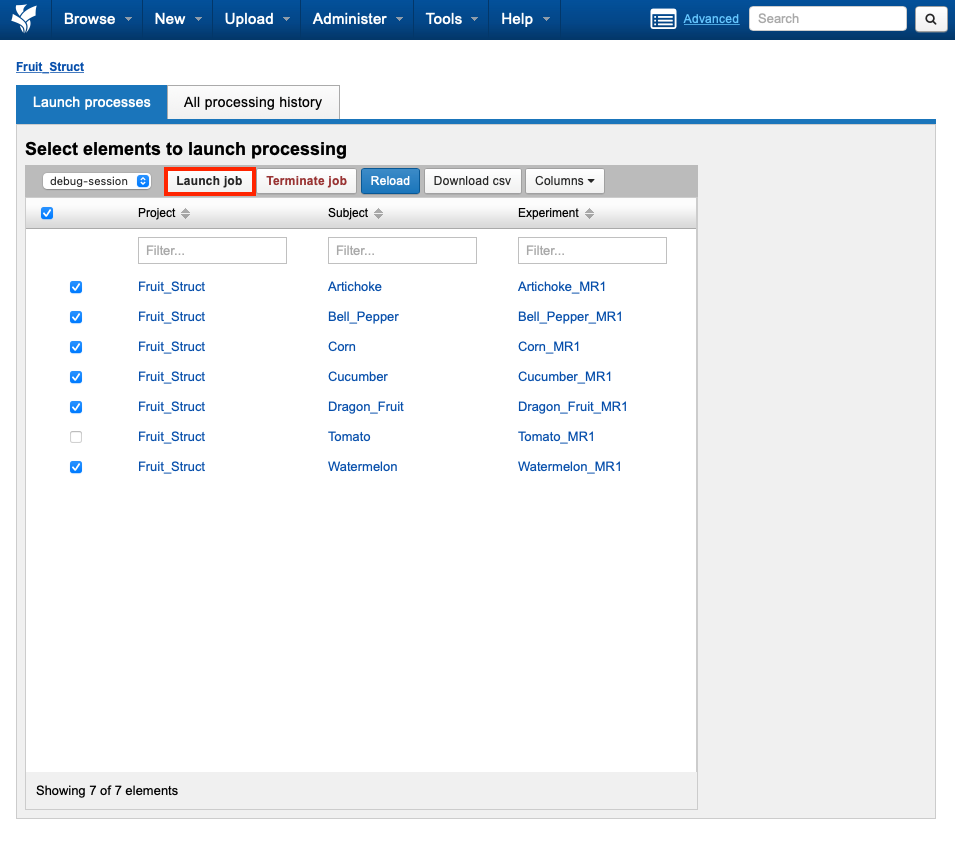
After an appropriate command and sessions are selected, choose Launch job to start the container launch process.
The container launch window shows resolved command parameters and user-settable inputs. User-settable inputs will be identical for all batch-launched containers. Select Run Container(s) to add containers to the queue and launch when resources are available.
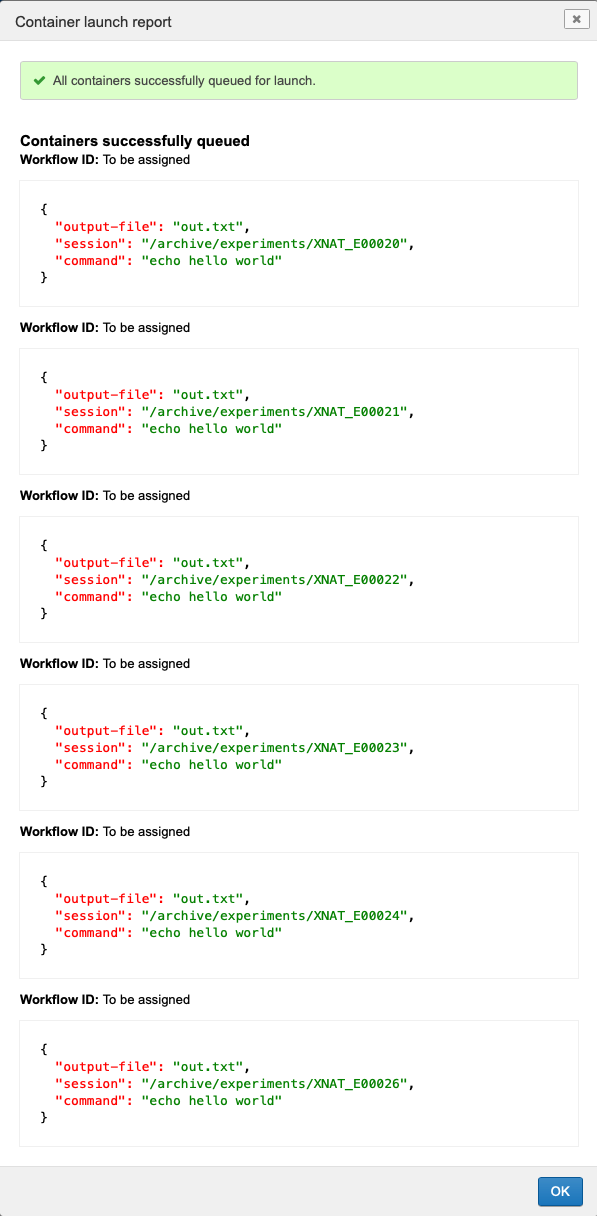
A container launch report window is shown, detailing all container inputs as well as any input resolution and launch errors.
Accessing Processing History
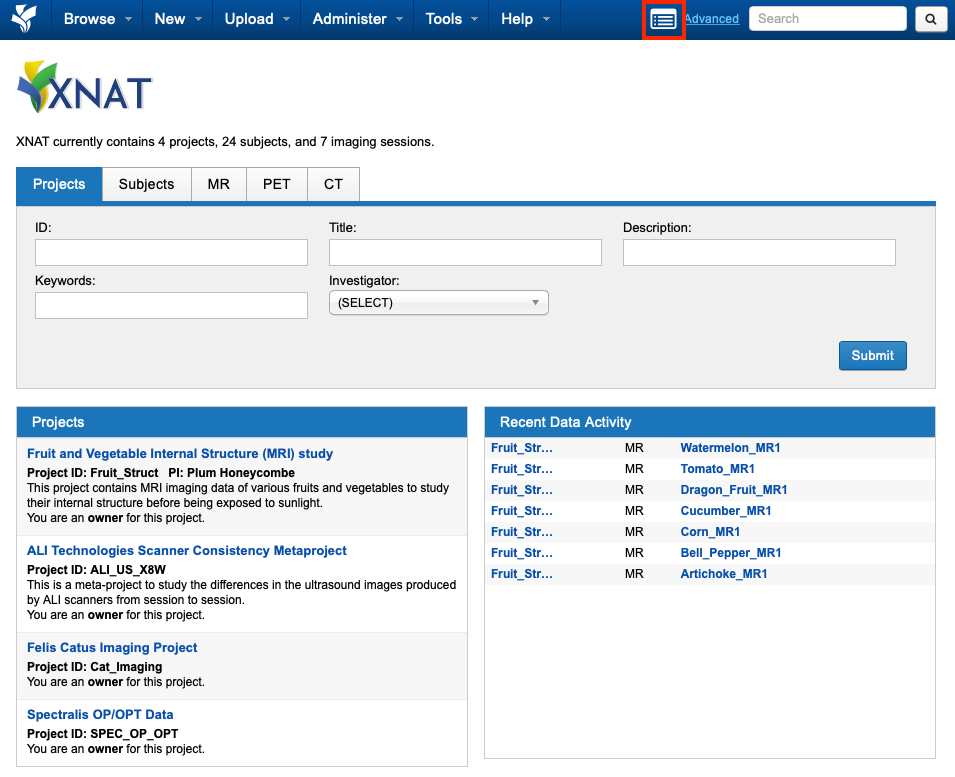
After container launch, processing history is available on the All processing history tab, as well as in the User Dashboard UI.
You can access processing history via the User Dashboard by clicking on this icon in the top menu bar.
The Processing history table lists XNAT workflow jobs, including container processing jobs. Action icons associated with each container history item open the container's build directory and history detail page.
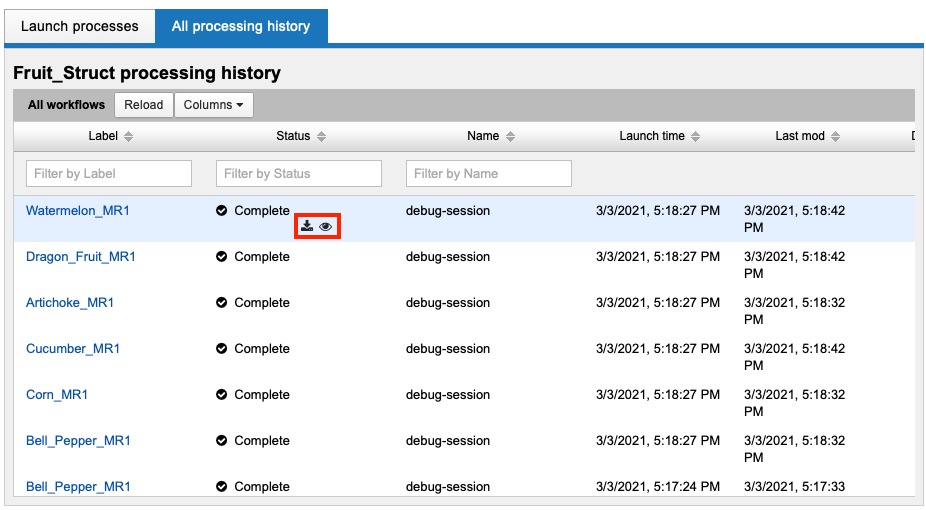
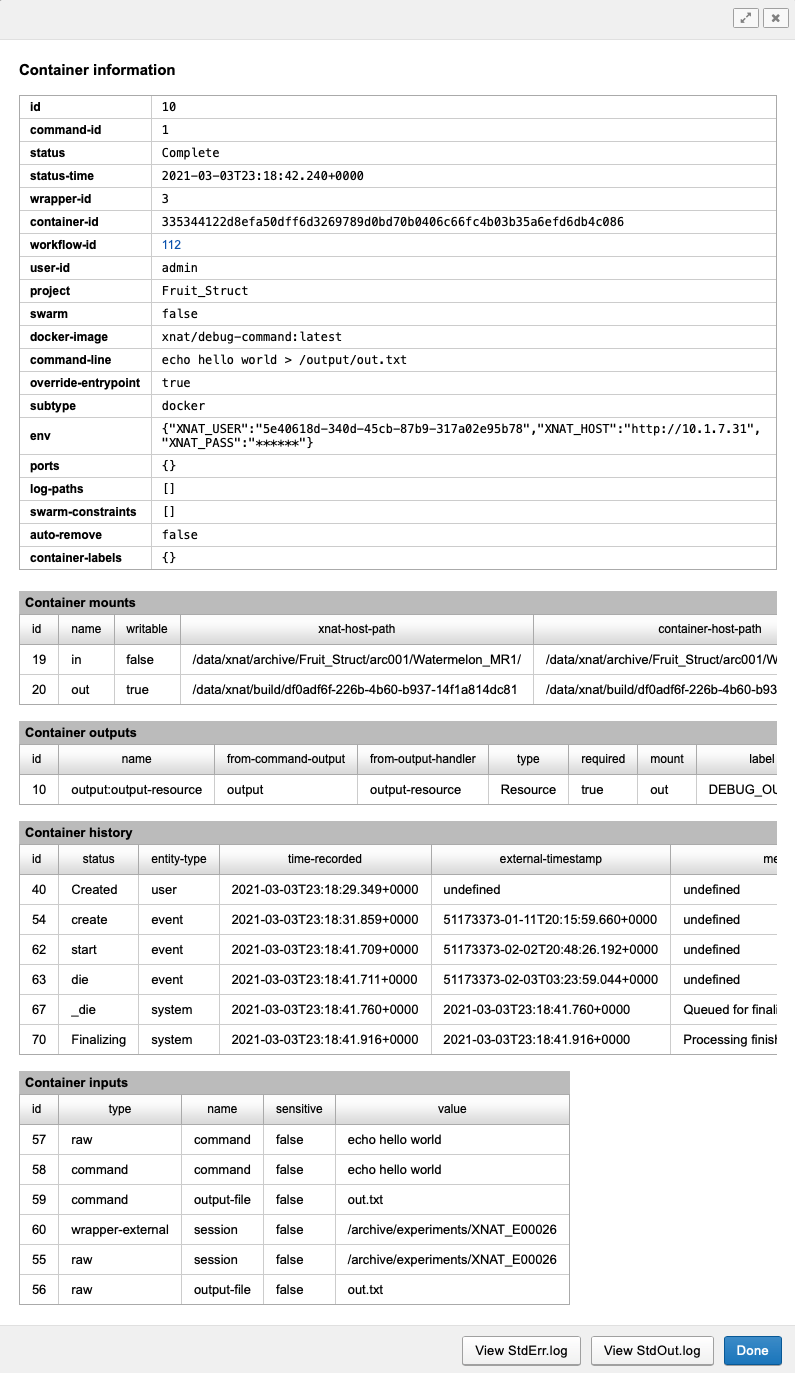
A container's history page shows resolved launch parameters as well as processing status and output logs.
Once container processing has finished on an XNAT object, the Processing Dashboard lists the outcome as a sortable column.
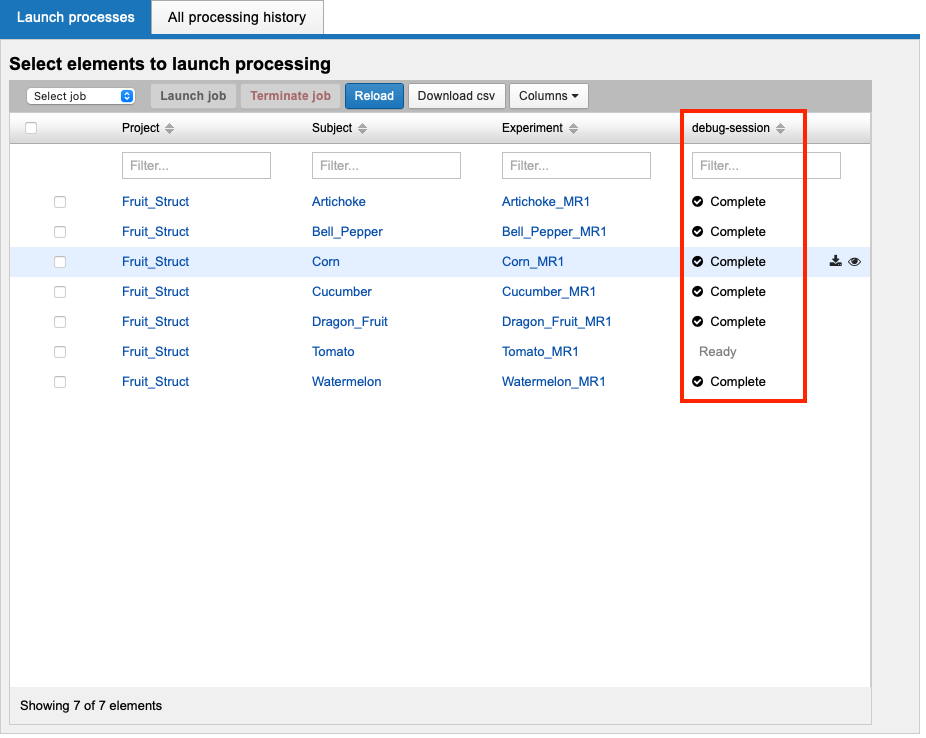
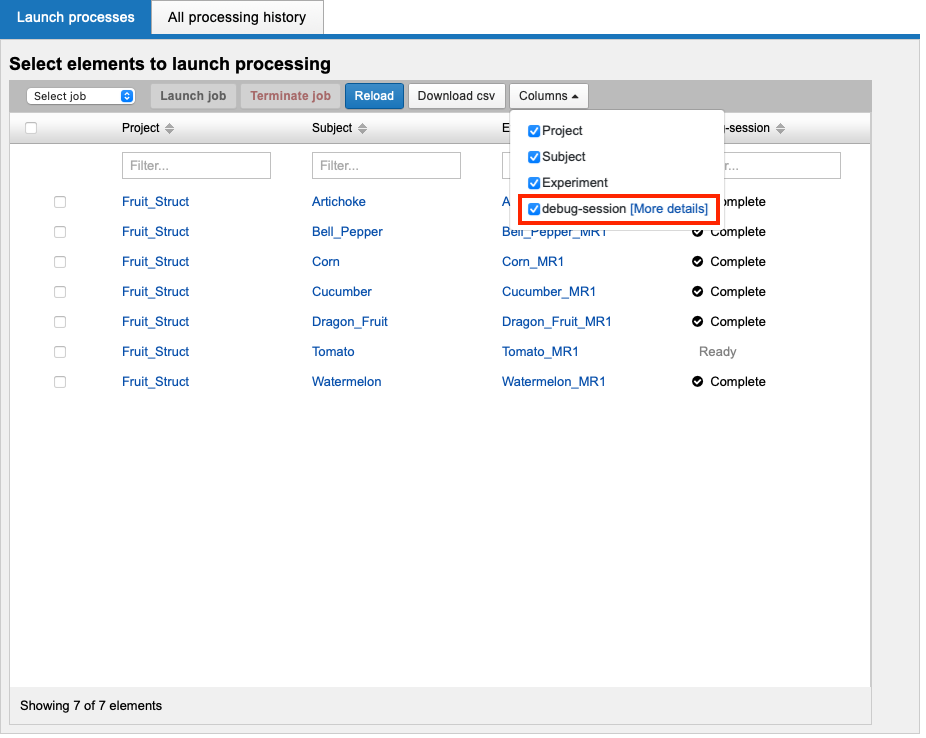
Additional container status properties can be added to the table using the Columns dropdown.
Using these properties, items that require processing or additional inspection can be identified and optionally selected for a new batch container launch.
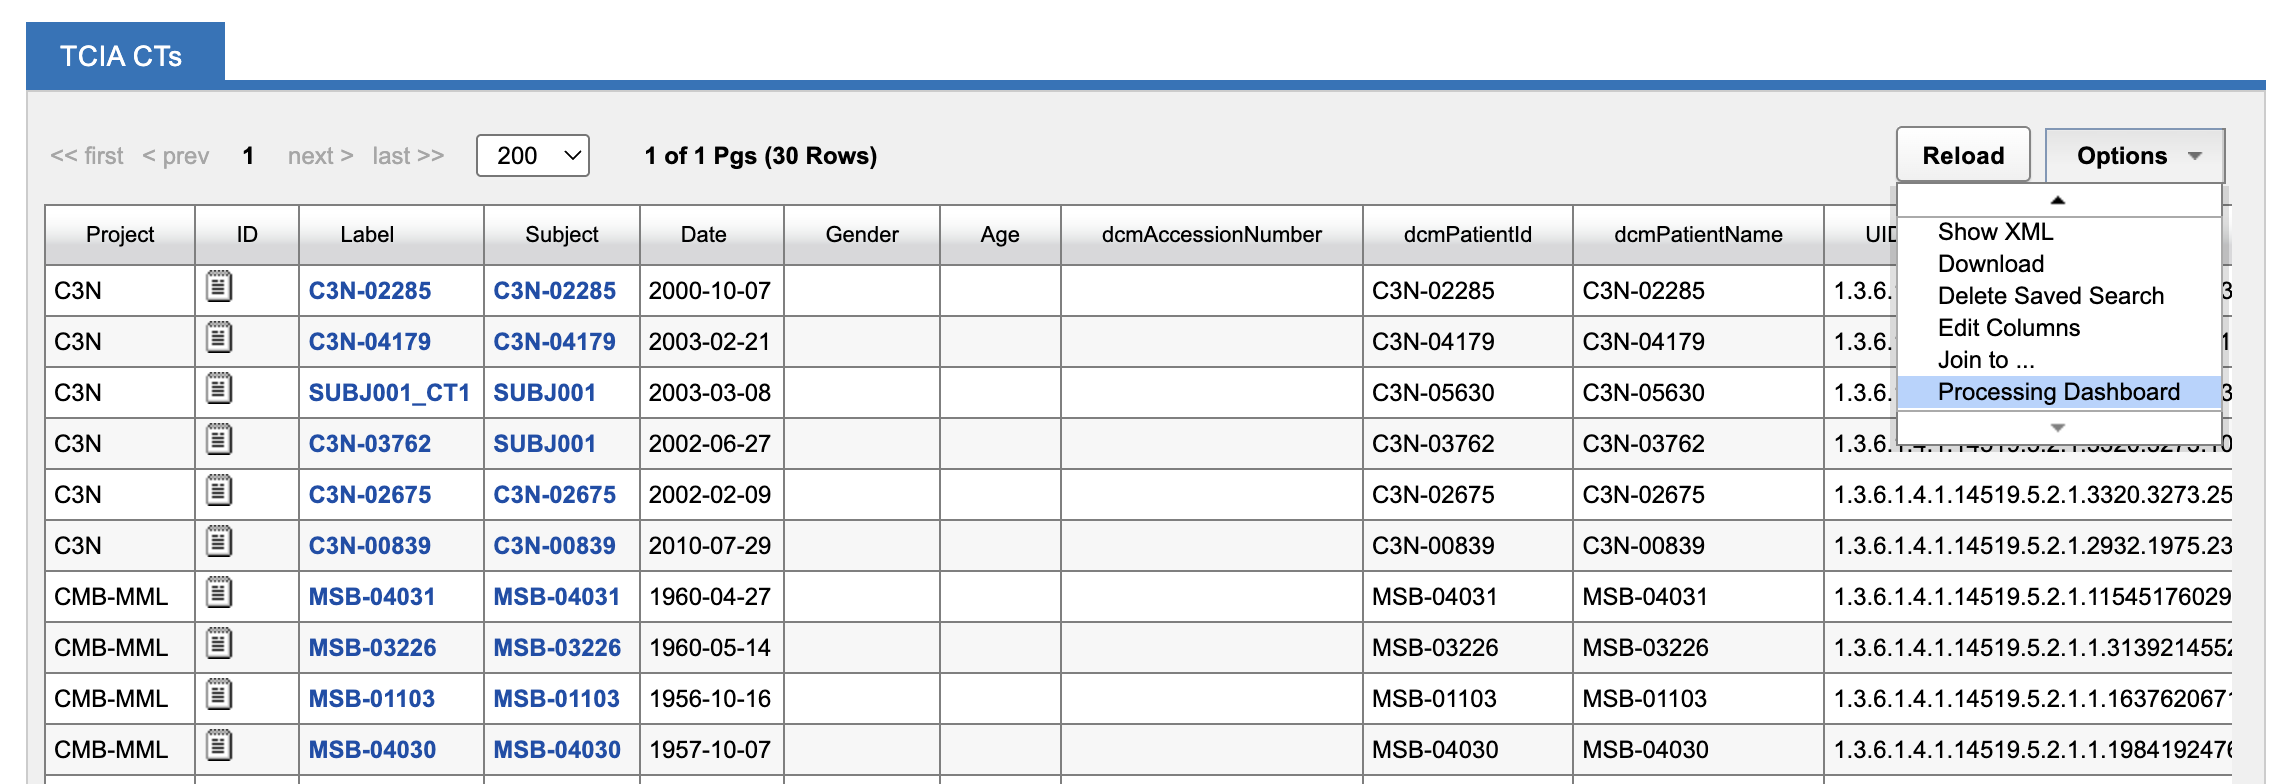
Launching the Processing Dashboard from a Search
Launching the bulk launch processing dashboard can be done from any search result table, by clicking into the Options at the top right of the table panel and scrolling down until you see Processing Dashboard as an option.
When you open the processing dashboard with multiple projects in context, the list of available commands you can run on that data will be limited to only the commands that are enabled in all projects that have data in this search.
For example, this stored search pulls from two projects: “C3N” and “CMB-MML”.
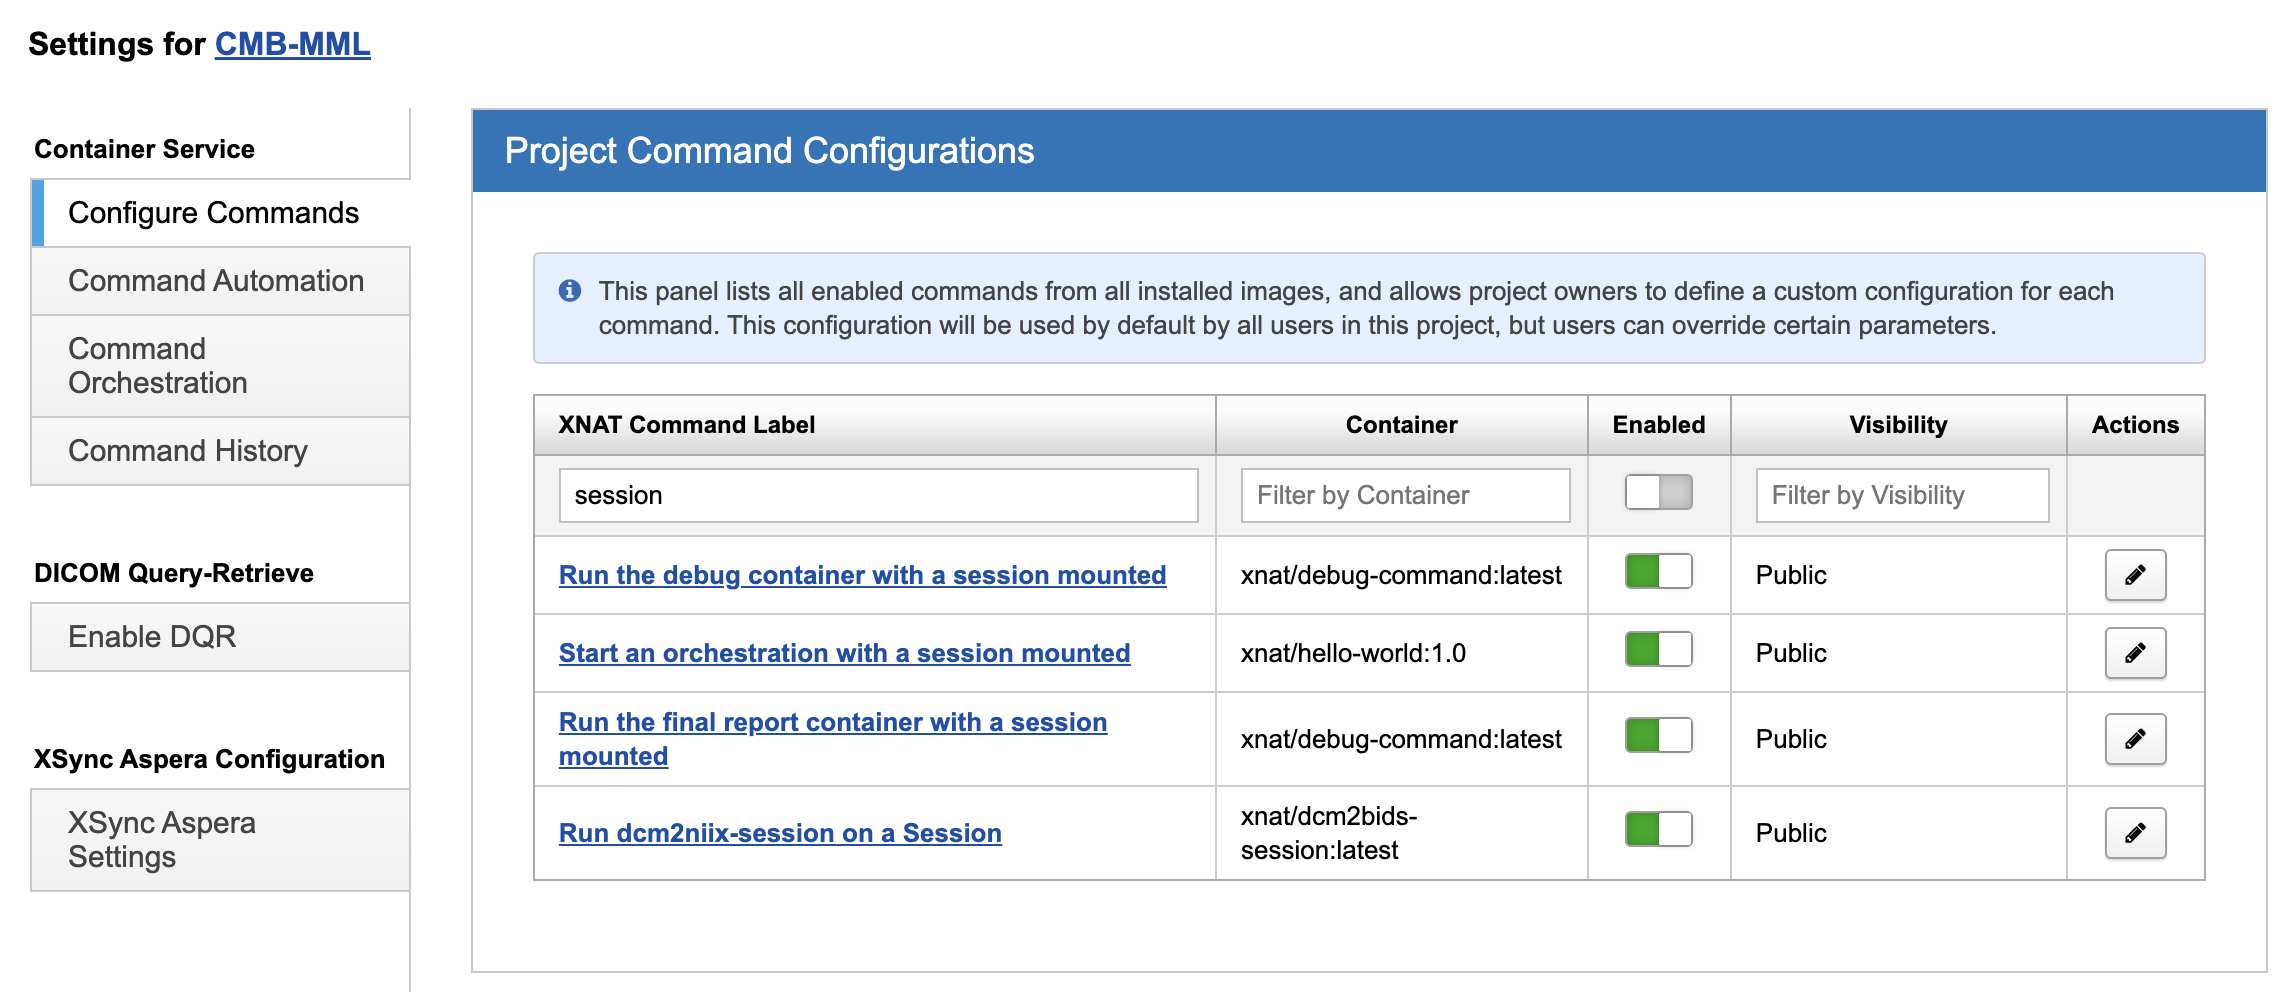
In the CMB-MML project, I have four commands enabled that can be run at the session context:
However, in the C3N project, I only have one command enabled:
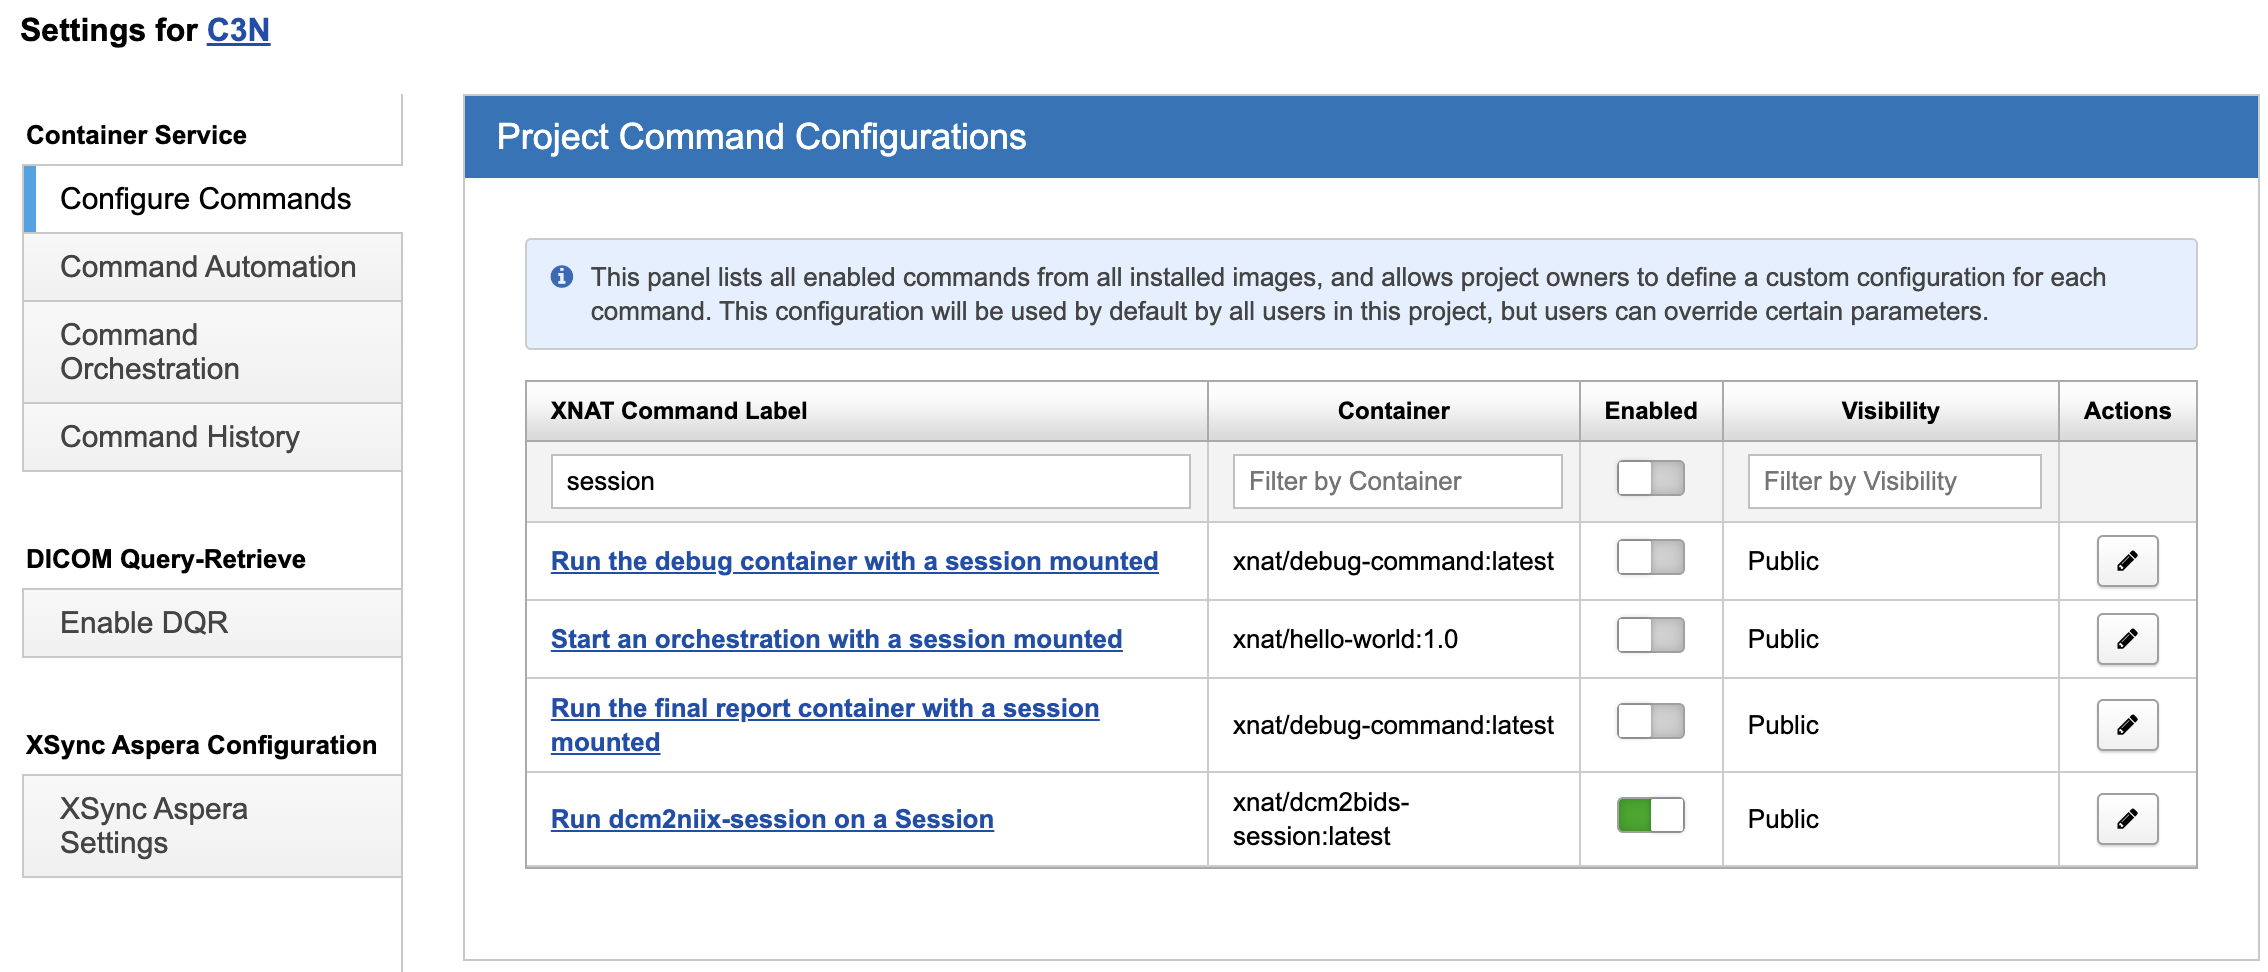
Therefore, when I launch the Processing Dashboard in context of the search that pulls from both of these projects, only one command is available to run.