Users with appropriate permissions can view the history of running and previously executed commands on the Command History control panel or on the User Dashboard. Both methods let you view container status and monitor container StdOut and StdErr logs in real-time.
Users with Admin privileges are able to monitor all container activity using the Command History control panel available at Administer → Plugin Settings → Command History.
Users with Project Owner privileges are able to monitor project-scoped container activity using the Command History control panel available on their project page at Project Settings → Command History.
Other users can access the history of containers they launched using workflow event tracking provided by the Batch Launch plugin's User Dashboard. For details see: Monitoring Processing with the User Dashboard
Command History Table
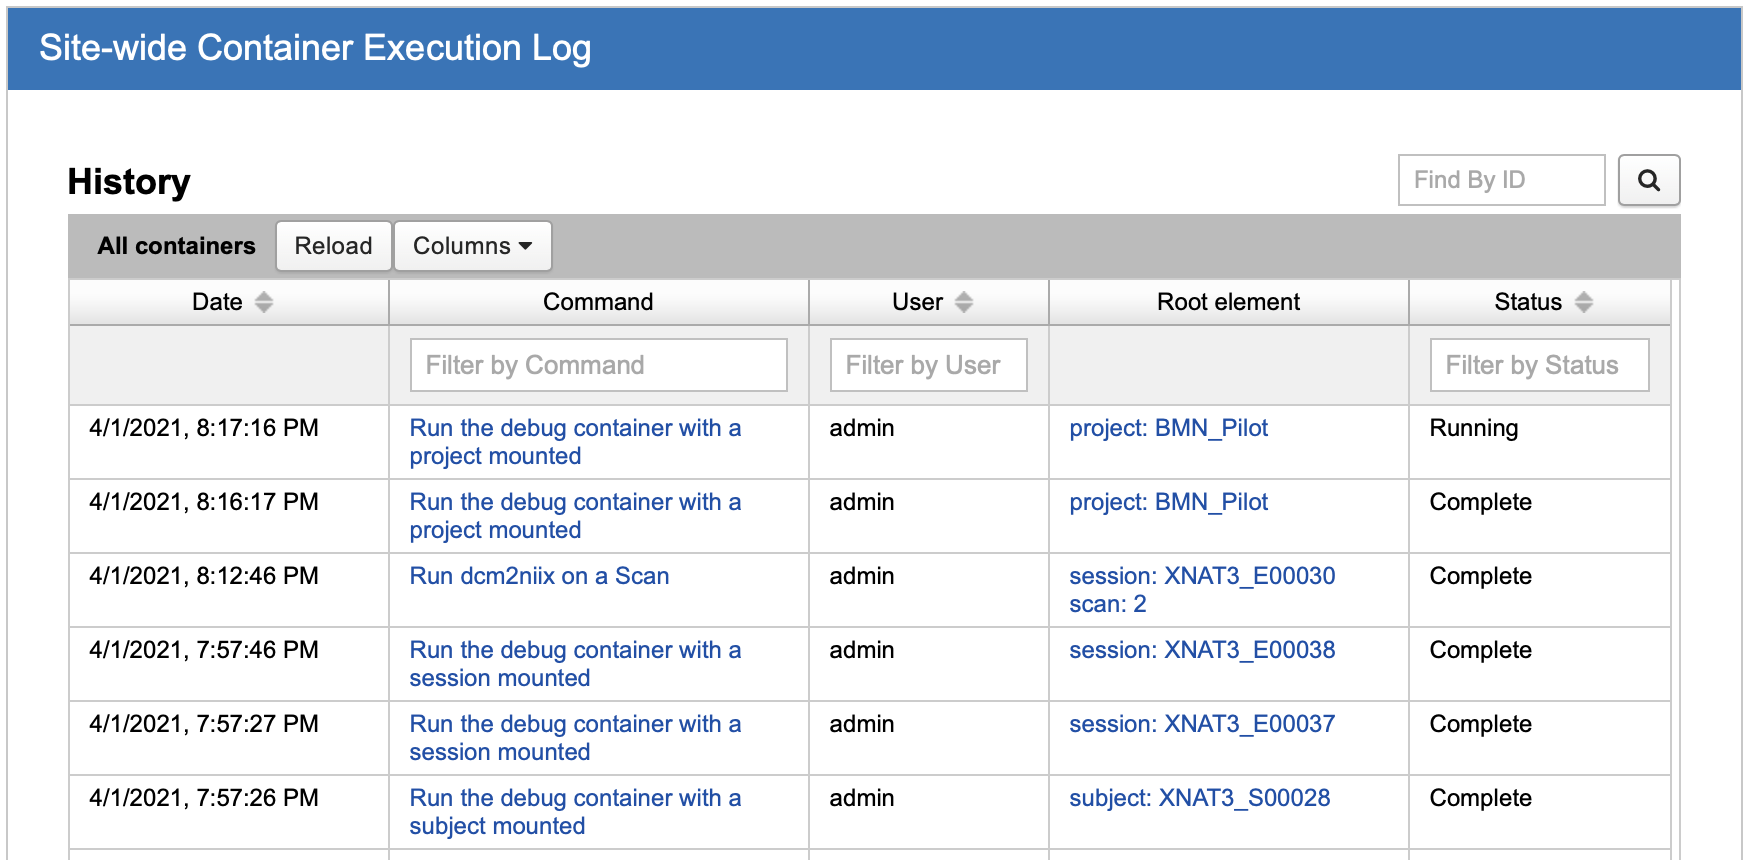
Site-wide and project level command history tables list container execution data, command description, container user, root element, and current status.
The `Root element` column links to the root workflow item. For most containers, this corresponds to the external input defined in a container's command, e.g. Project, Subject Session, etc. The `Command` column links to a model window detailing a container's runtime settings and status.
Container Details
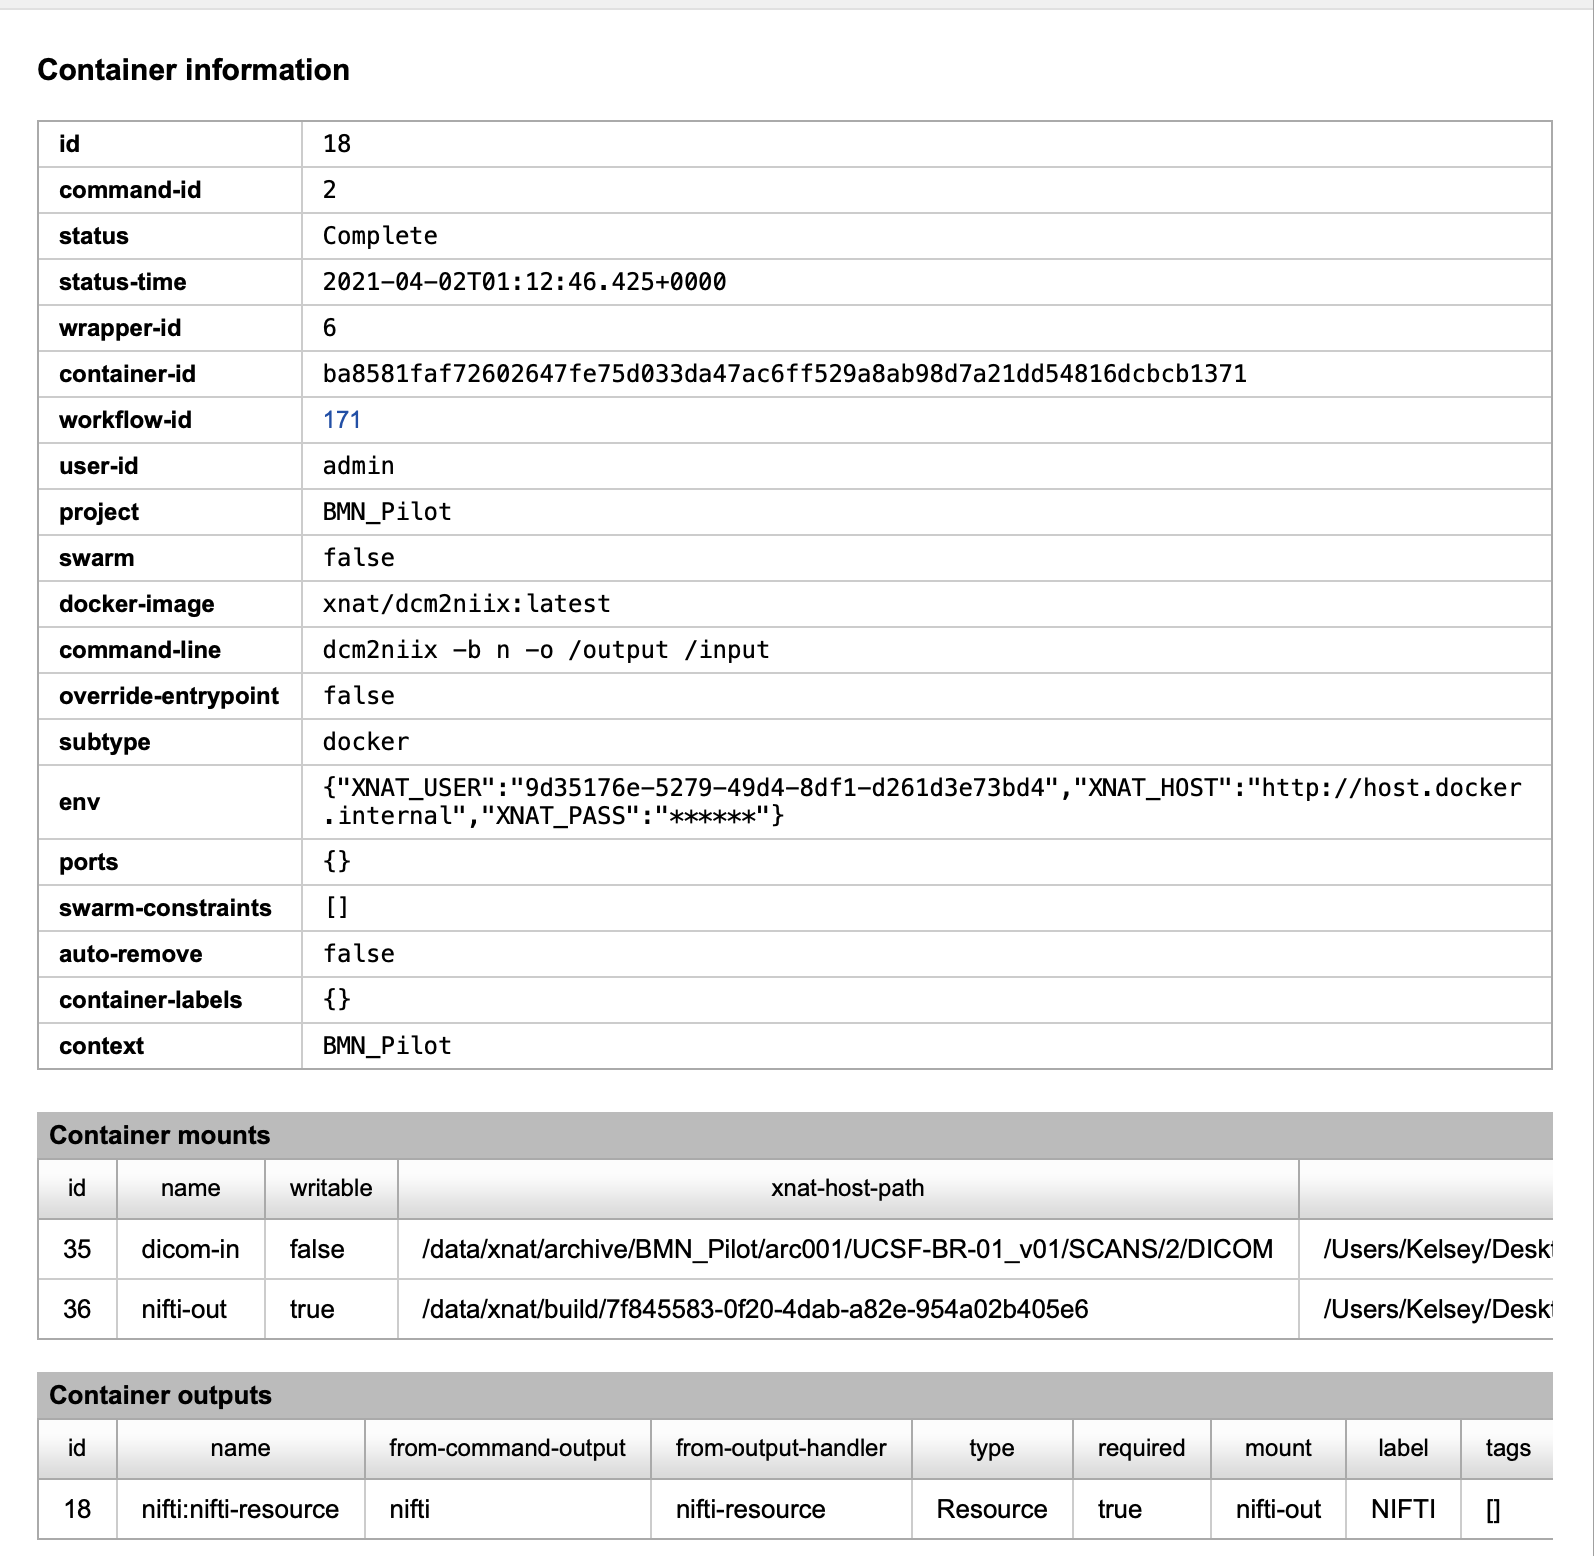
Clicking the `Command` column of a history item opens a detailed view of a container's provenance. Information includes parameters set in the corresponding command and those resolved at container launch. Note especially command-line and env values.
command-line contains the command passed to a container shell or entrypoint at startup.
env contains key:value pairs added to the container's environment variables. At least three environment variables are always added: XNAT_HOST, XNAT_USER, and XNAT_PASS. See: How the Container Service Launches Docker Containers for details.
Container mounts - lists of mount points that were created for your container.
container-path : the absolute path inside your container at which the mount was created.
xnat-host-path : the path on your host that XNAT can access this folder mount.
container-host-path : the path your Docker host can access this folder mount. Note: this value is different from xnat-host-path only if Path Translation is configured.
Container outputs -lists output handlers that will be used to upload files produced by the container.
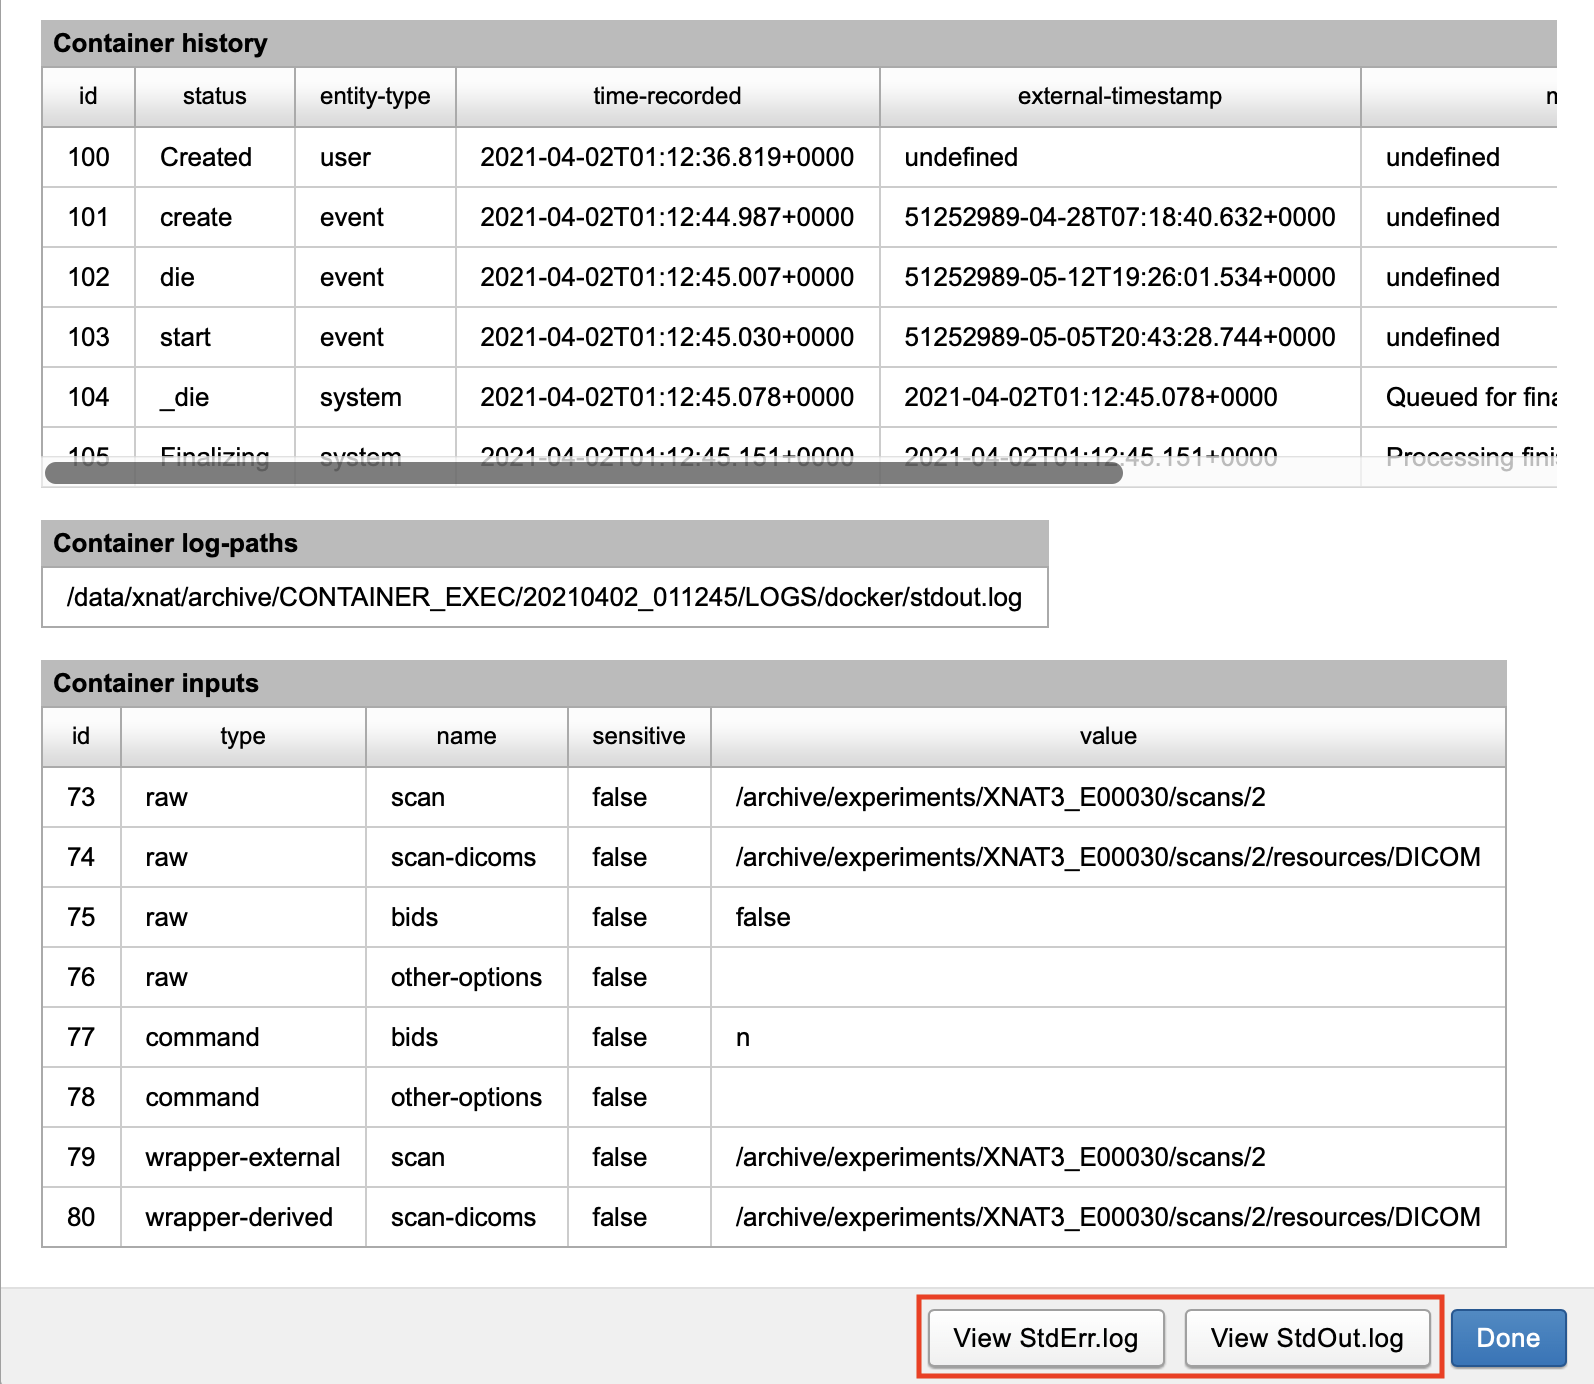
Container inputs - lists all command inputs, external inputs, and derived inputs along with their resolved values.
Container history - Container status lifecycle is itemized in the Container history table. SeeContainer Statusesfor a detailed discussion of expected and possible container statuses.
Container Log Monitoring
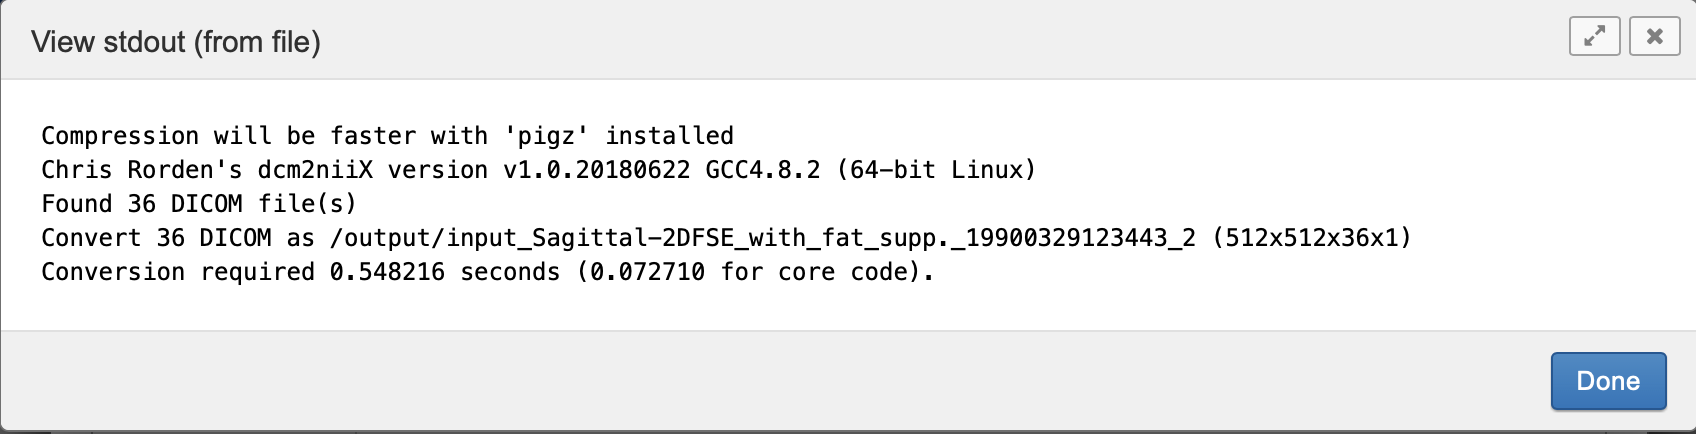
Users can access archival or real-time StdOut and StdErr streams from containers managed by the Container Service by clicking on the `View StdErr.log` and `View StdOut.log` buttons on the Container Details window.
Any stdout and stderr streams produced by a container are stored in the XNAT database upon container finalization. Log files from containers that are still running will have their stdout/err streams updated periodically, giving the user a real-time look at container processing.
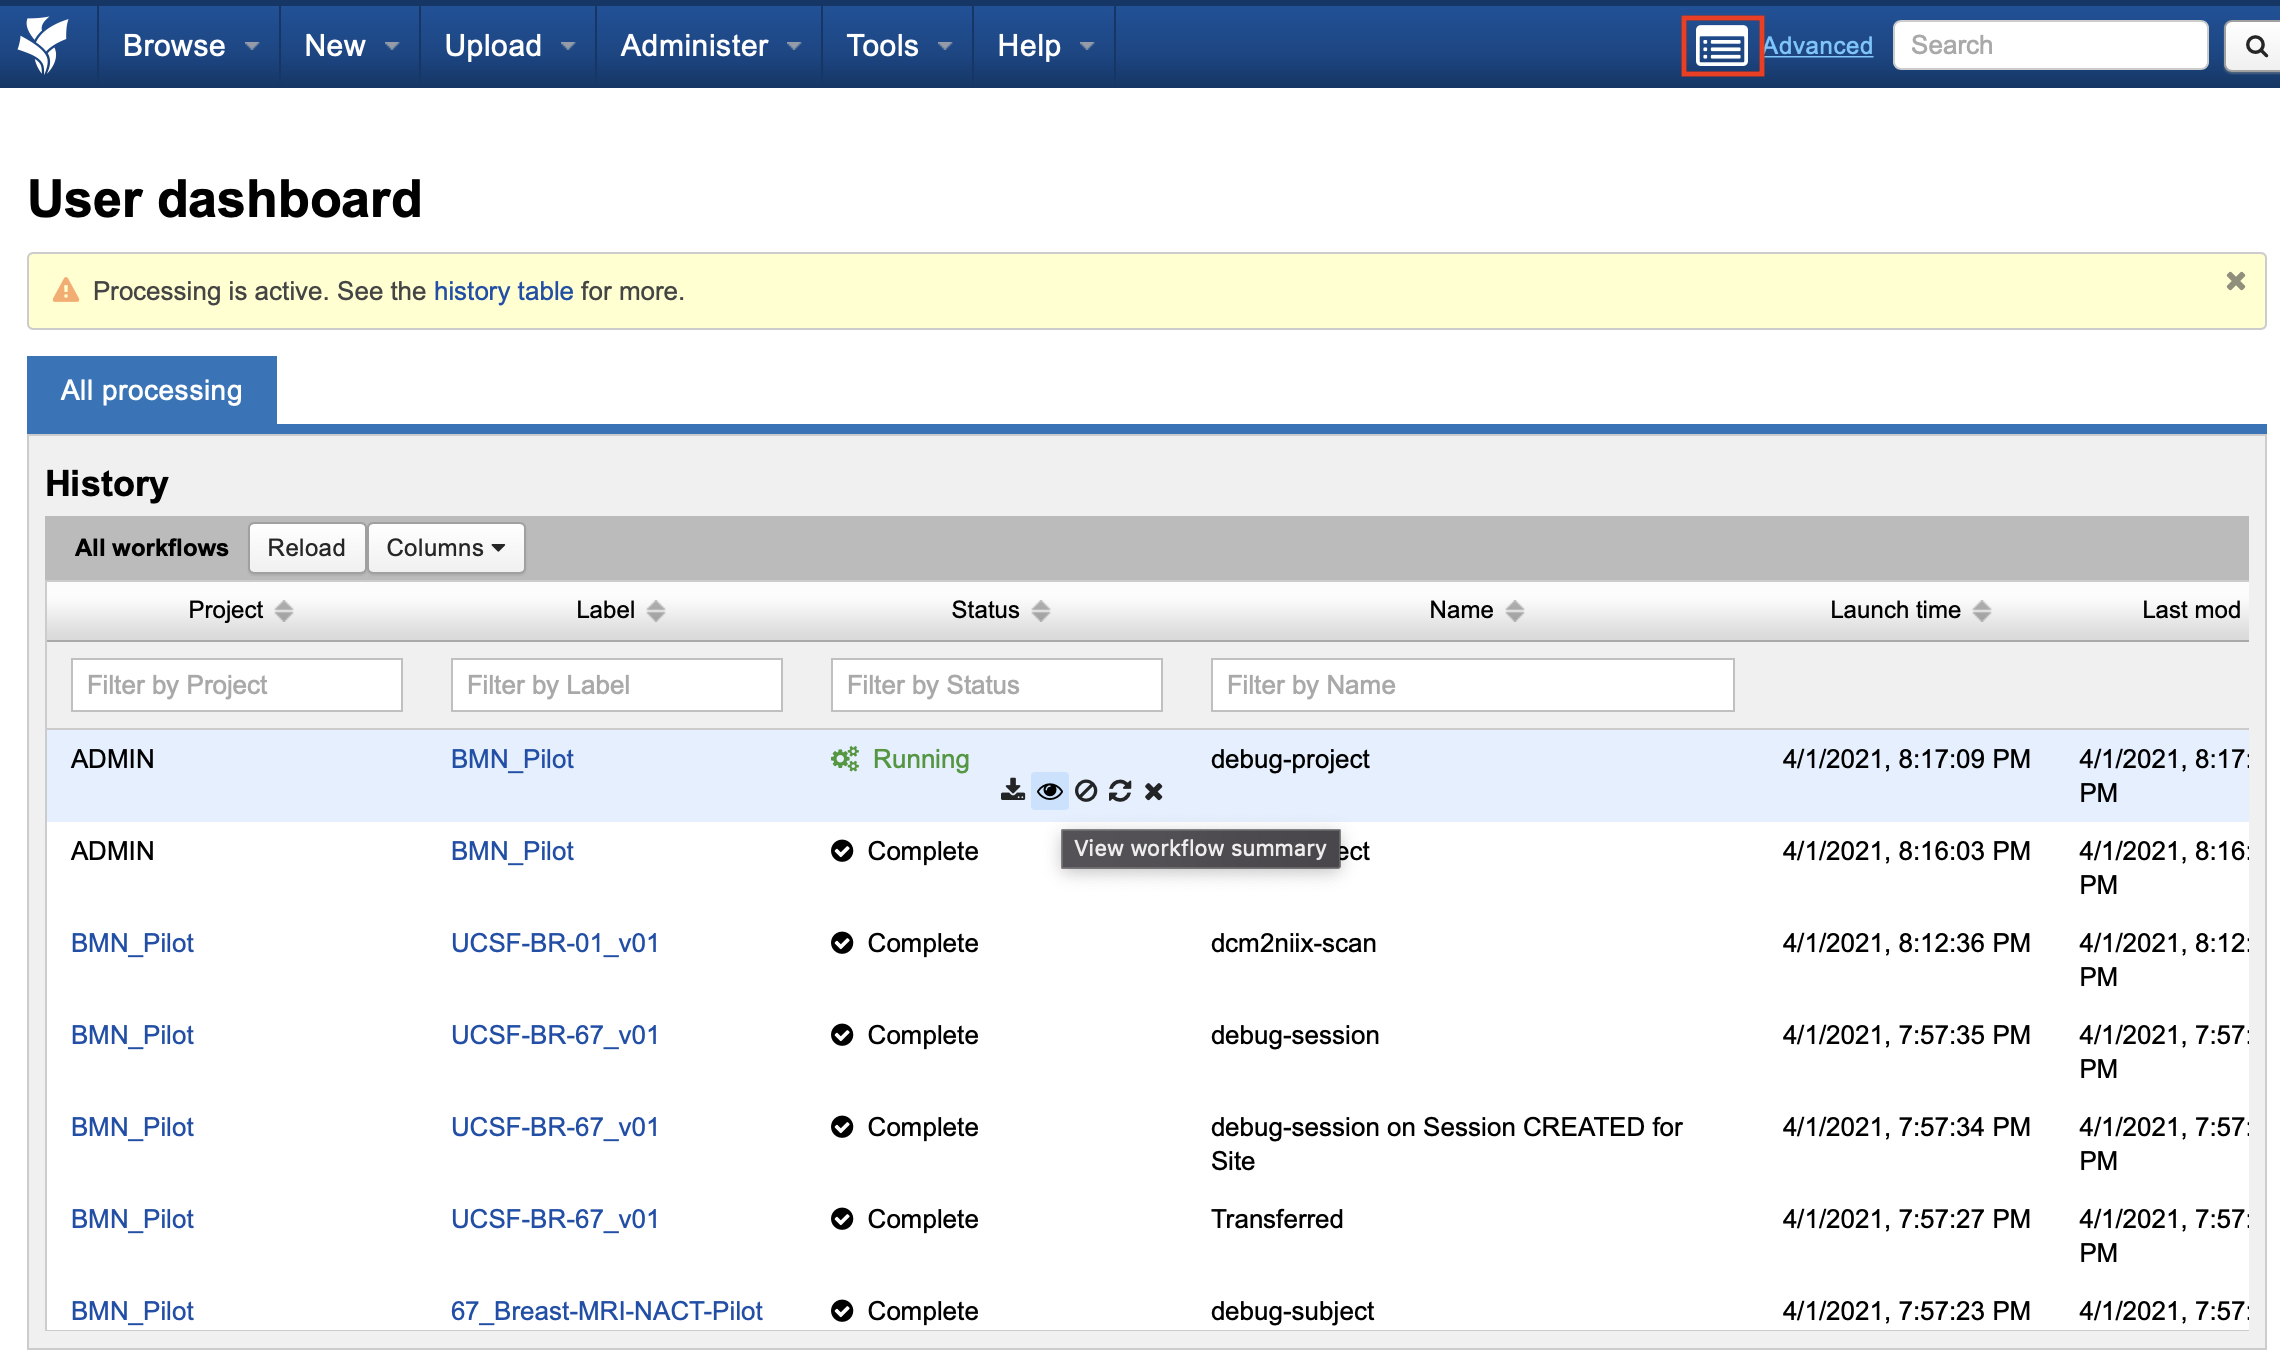
On XNATs with the Batch Launch plugin installed, users can access the dashboard via the icon near the search box. The User Dashboard shows workflow processes including Container Service processing state. Most users will see owned processes while XNAT Administrators will see all site-wide processes. To view container history details, including status and access to logs, click the icon in the Status column of a container entry.
Other workflow action icons lead to detailed workflow inspection views and action controls.
View build directory - view temporary directories associated with a workflow.
View workflow summary - view workflow details, e.g container process details and logs.
Terminate job - force workflow termination, e.g. stop processing container.
Refresh workflow status - update workflow status.
Mark workflow as failure - Change workflow status to failed.
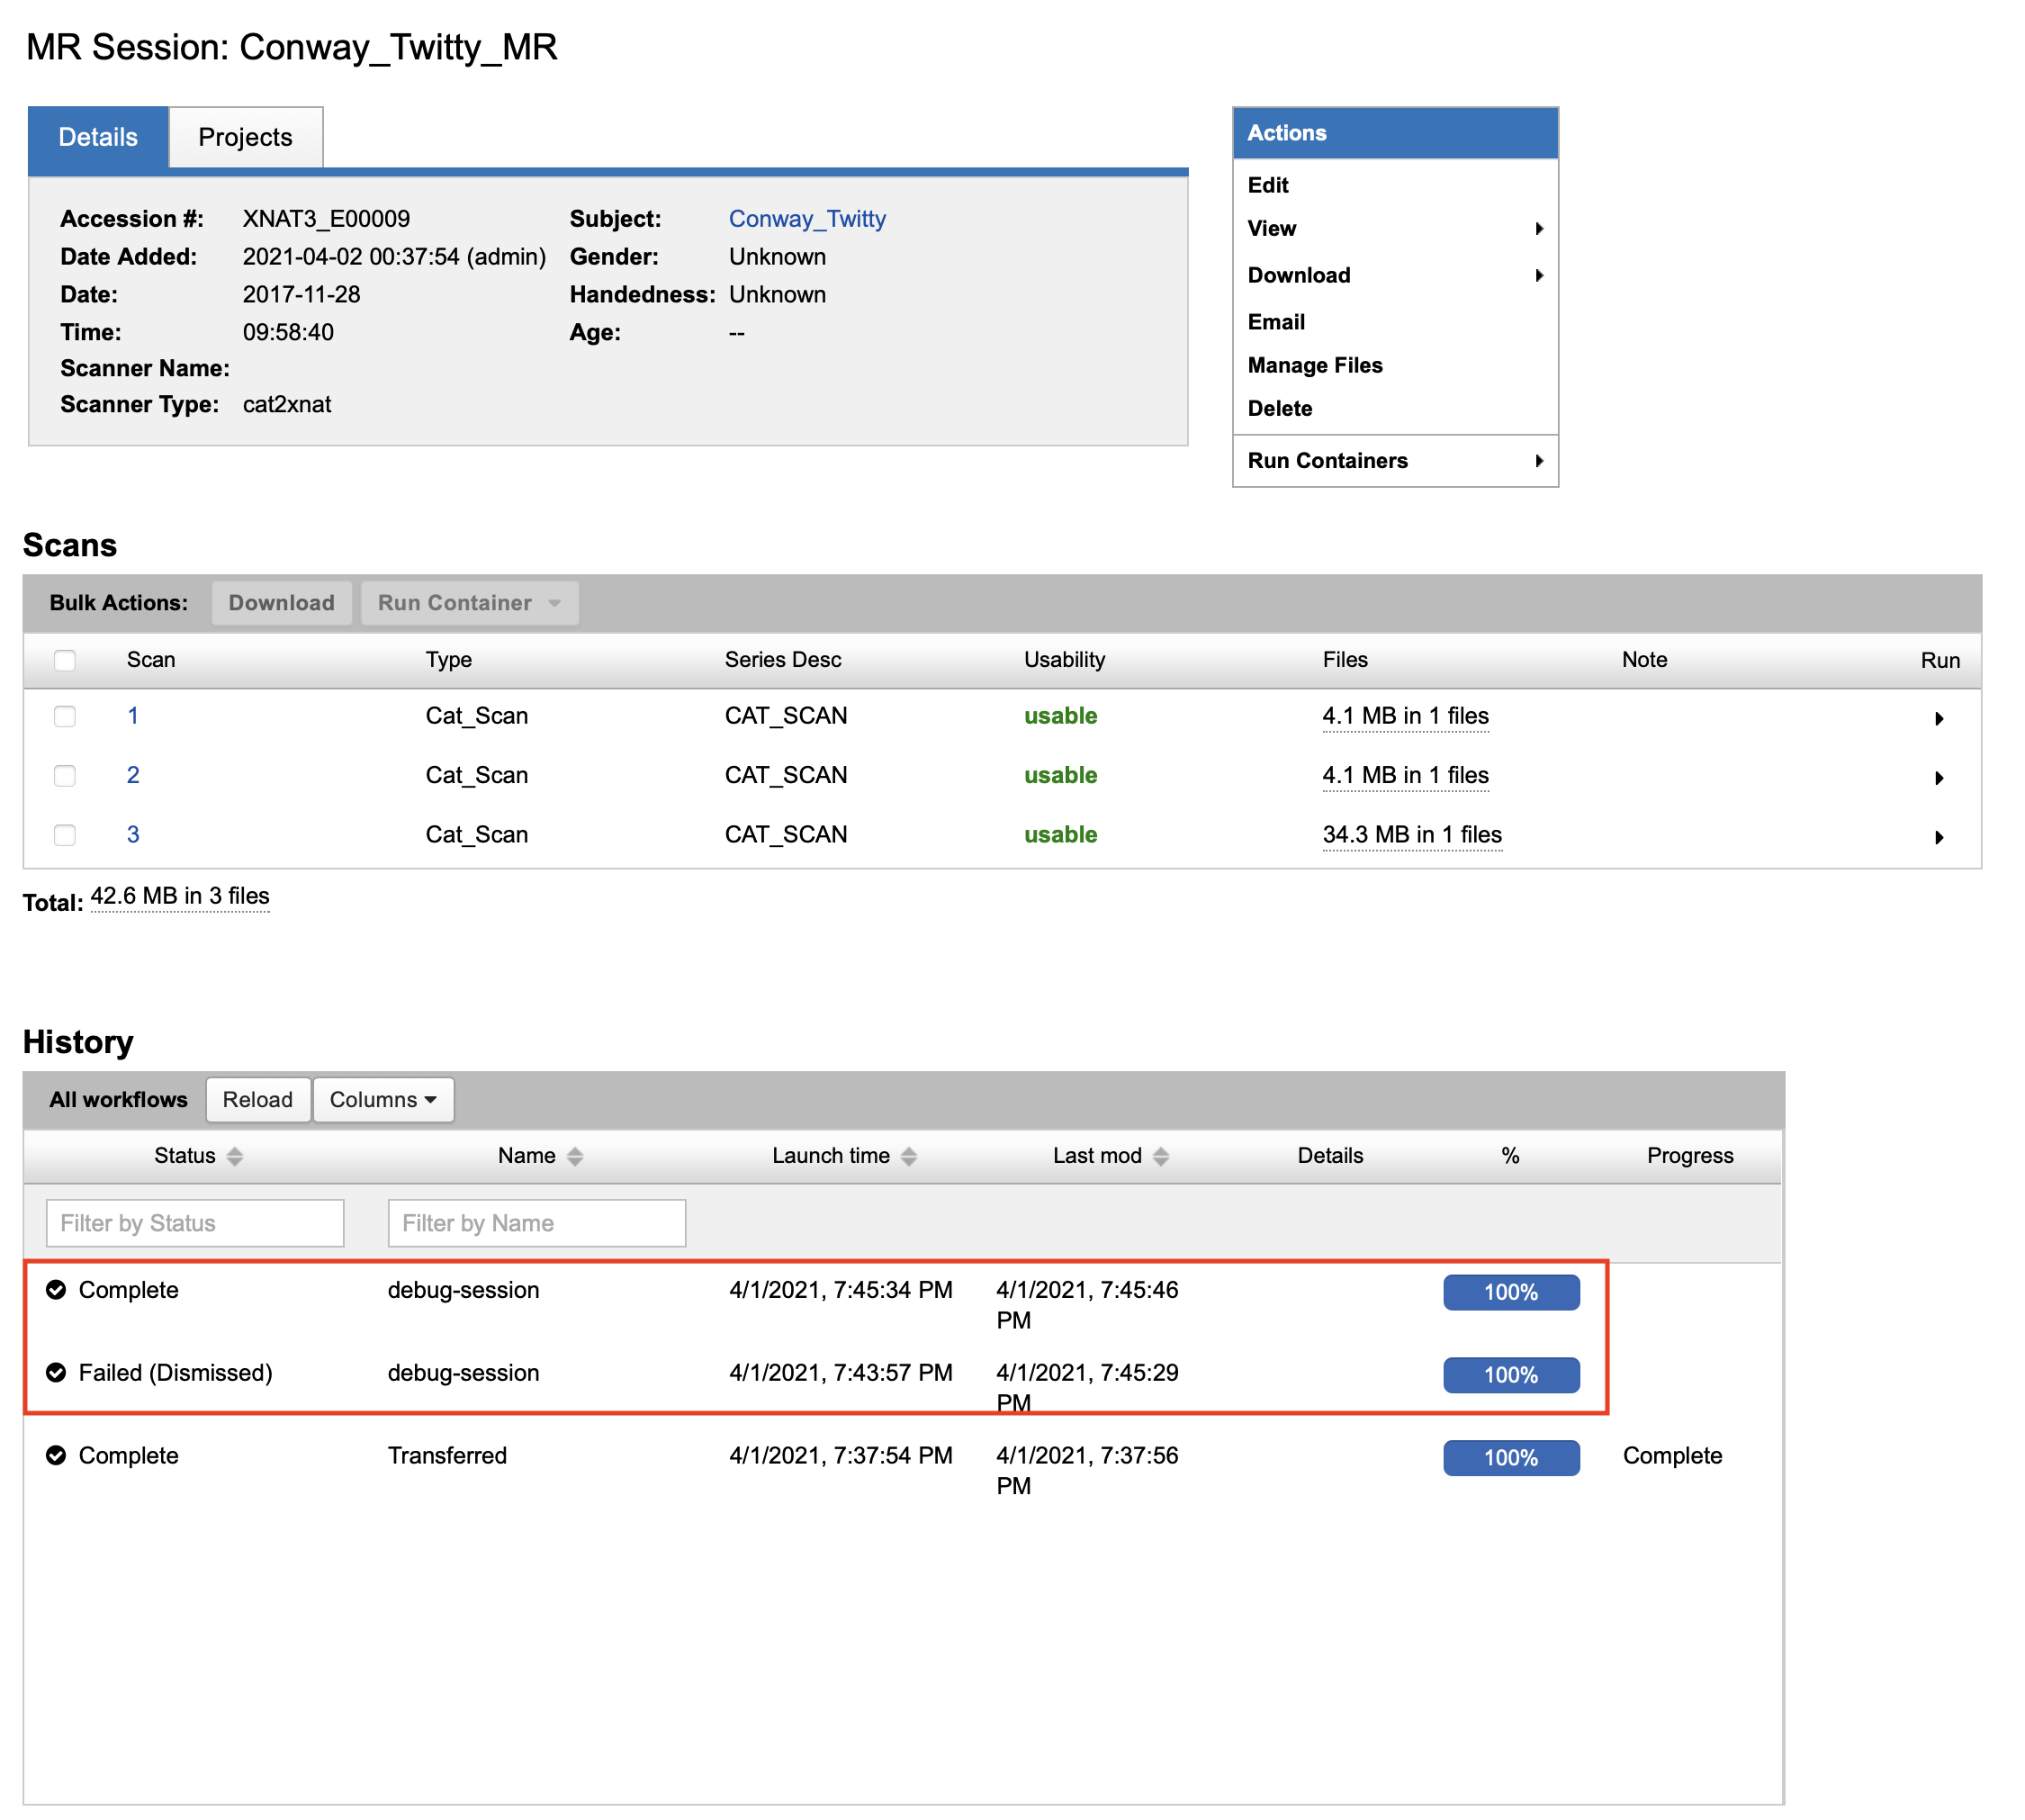
Session History Extension
Adding the Batch Launch plugin to a compatible XNAT overrides the basic workflow history table on the XNAT Session page. Extended functionality in this table adds features similar to the User Dashboard, including access to container history (workflow summary).
JavaScript errors detected
Please note, these errors can depend on your browser setup.
If this problem persists, please contact our support.