Using Python Dashboards in XNAT via JupyterHub
The JupyterHub plugin for XNAT introduces a feature for deploying Python-based dashboards from the XNAT UI. Leveraging popular Python dashboarding frameworks such as Dash, Panel, Streamlit, and Voilà, this feature helps bridge the gap between technical and non-technical users. Data scientists, researchers, and other technical users can create interactive visualizations and applications that can then be started by general users within the XNAT UI. This guide will walk you through the basics of creating and deploying dashboards in XNAT.
Installation
This section will cover the XNAT and plugin requirements for dashboards as well as how to set up your Jupyter Environment for dashboard development and deployment.
XNAT and Plugin Requirements
Must be running the XNAT JupyterHub integration plugin version 1.1.0 or higher and XNAT 1.8.10 or higher. You may need to refresh your browser cache after upgrading the plugin.
XNAT JupyterHub Version Compatibility Matrix
Jupyter Environment Setup
All dashboards are deployed within existing Jupyter Environments and Hardware. We will cover what packages need to be installed in your Jupyter Environment for dashboard development and deployment. If you are using the latest xnat/datascience-notebook image image for your Jupyter Environment, you do not need to install any additional packages and can skip this section.
The following packages must be installed in the Jupyter Environment (i.e. Docker image) that you are using:
juptyerhub (already required for any Jupyter Environment)
The following packages are required for each dashboard framework:
Panel: panel and bokeh-root-cmd
Streamlit: streamlit and jupyter-server-proxy
Voilà: voila
The jhsingle-native-proxy package is crucial for the proper functioning of the dashboards. This package is an open-source package developed to wrap an arbitrary web application in place of running JupyterLab. OAuth authentication is still enforced based on JUPYTERHUB_* environment variables.
The jupyter-server-proxy is not required for Dash Streamlit dashboards, but is very useful for testing. This package lets you run arbitrary external processes (such as Dash and Streamlit) alongside JupyterLab, and provides authenticated web access to them. You can use this package to help test Dash and Streamlit dashboards within your Jupyter Environment before deploying them in XNAT.
Dashboard Creation
Development Flow
The following is the general development flow for creating and deploying dashboards:
Develop a Jupyter Notebook or Python script in the Jupyter Environment where the dashboard will be deployed.
Commit and push the notebook or script to a Git repository accessible to your XNAT instance.
In XNAT, create a dashboard using the Git repository URL, branch, and path to the notebook or script. Specify the Jupyter Environment, Hardware, and dashboard framework for deployment. Select the XNAT data types to enable for the dashboard. This step requires admin privileges and only needs to be done once.
Enable the dashboard at the site and project level in XNAT.
Test the deployed dashboard in XNAT.
For updates, modify the dashboard, commit and push changes to the Git repository. The dashboard pulls updates from the repository whenever it starts.
Supported Frameworks
This plugin is pre-configured to support the following dashboard frameworks:
Additional frameworks can be configured as needed.
Each of these frameworks has a unique approach to creating dashboards. Some, like Voila, utilize Jupyter Notebooks, while others, like Streamlit, require a Python script. Regardless of the framework, all dashboards are deployed via JupyterHub, similar to Jupyter Notebooks on XNAT. This ensures that they have access to the same environment variables and mount points as Jupyter Notebooks, and consequently, the same XNAT data.
For detailed instructions on creating a dashboard with each framework, please refer to their respective documentation.
Creating Dashboards
We will cover how to create and test a Dash, Panel, Streamlit, and Voila dashboard in your Jupyter Environment.
Panel
Panel is a Python framework for data exploration and creating web applications. It enables the creation of interactive dashboards and applications from Python code.
To create a Panel dashboard, follow these steps:
Create a Python script in your Jupyter Environment: Your script should include Panel
.servable()components. These components are the elements of your dashboard that will be displayed to the user. It's important to create and test your script within the Jupyter Environment where the dashboard will be deployed.Test your dashboard: Use the Panel preview widget in JupyterLab to test your dashboard. This allows you to see how your dashboard will look and behave before deploying it.
Commit and push your script to a Git repository: Once you're satisfied with your dashboard, commit your script to a Git repository and push your changes. This repository should be accessible to your XNAT instance.
Configure your dashboard in XNAT: You will need the URL of your Git repository, the branch, and the path to the script within the repository to configure your dashboard in XNAT.
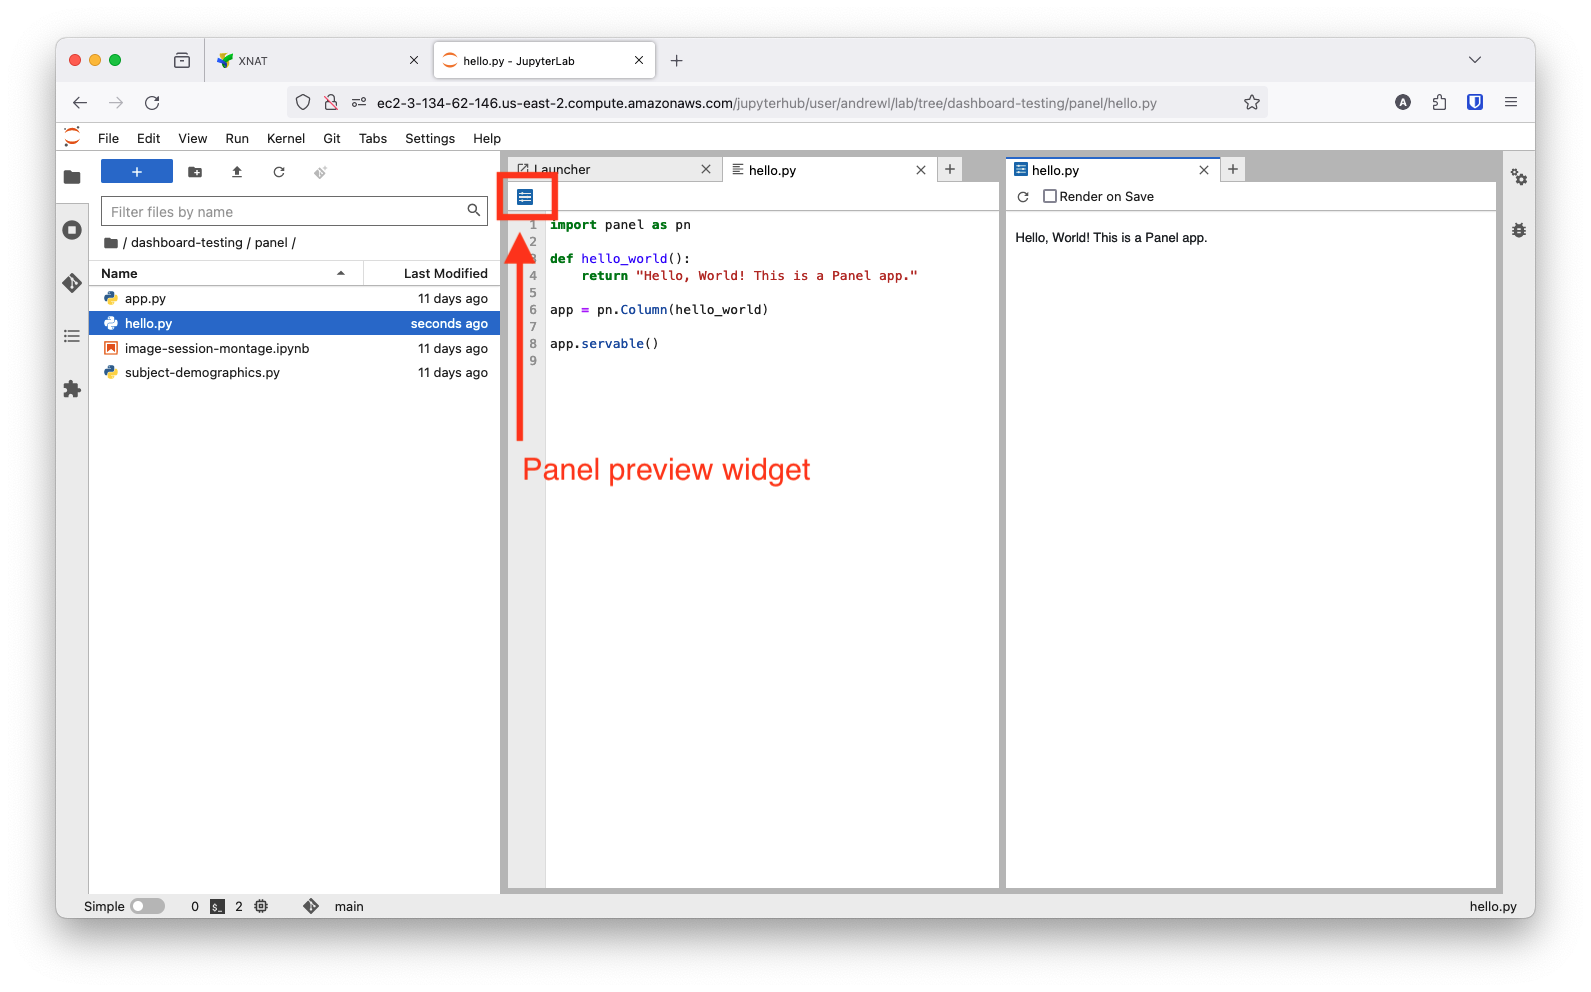
Use to Panel preview widget to test as a dashboard.
To improve the user experience of Panel apps, checkout these Panel documentation pages:
Voilà
Voilà is a dashboarding framework built on top of Jupyter Notebooks. It allows you to create a notebook that can be deployed as a standalone interactive dashboard, making it a great option for quickly creating dashboards from existing notebooks.
To create a Voilà dashboard, follow these steps:
Create a Jupyter Notebook in your Jupyter Environment: Your notebook should be designed to function as an interactive dashboard. It's important to create and test your notebook within the Jupyter Environment where the dashboard will be deployed.
Test your dashboard: Use the Voilà preview widget in JupyterLab to test your dashboard. This allows you to see how your dashboard will look and behave before deploying it.
Commit and push your notebook to a Git repository: Once you're satisfied with your dashboard, commit your notebook to a Git repository and push your changes. This repository should be accessible to your XNAT instance.
Configure your dashboard in XNAT: You will need the URL of your Git repository, the branch, and the path to the notebook within the repository to configure your dashboard in XNAT.
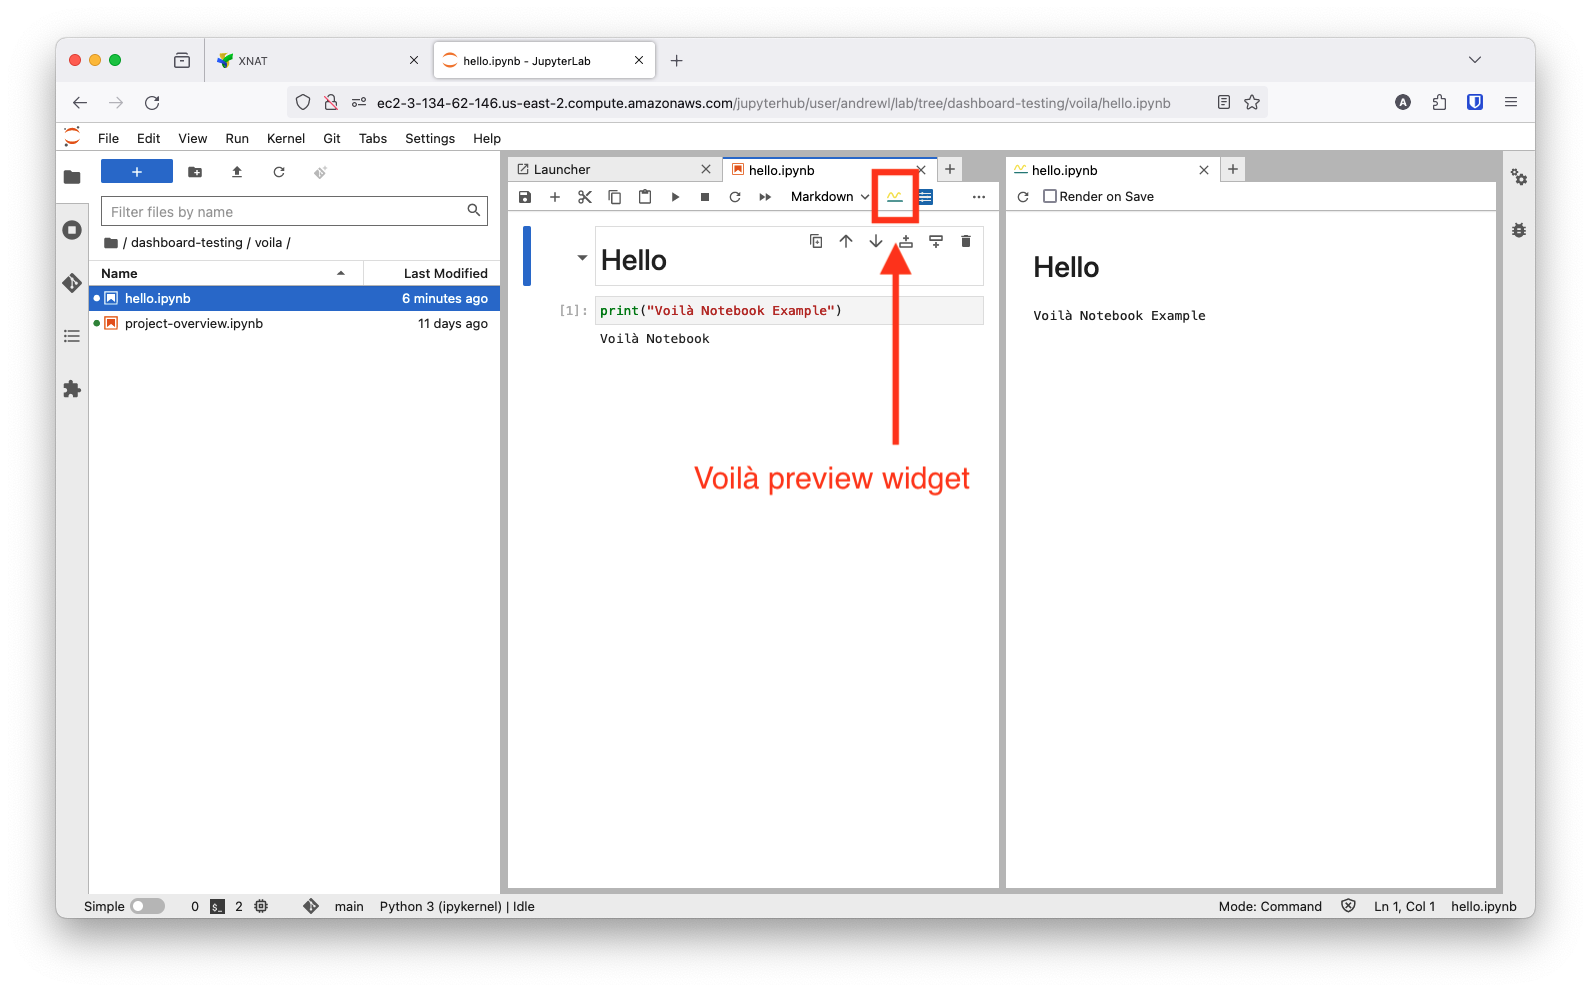
Use to Voilà preview widget to test as a dashboard.
Dash
Dash is a Python framework for building analytical web applications. It's particularly suited for anyone who works with data in Python.
To create a Dash dashboard, follow these steps:
Create a Python script in your Jupyter Environment: Your script should use the Dash API to create your dashboard. It's important to provide Dash the 'requests_pathname_prefix' argument when creating your app. This will ensure that the Dash app knows where to request assets from (e.g.CSS, JS, etc.). It is also important to set the 'host' parameter to '0.0.0.0' when running the app to account for running in a Docker container.
PYfrom dash import Dash, html import os port = 8050 jupyterhub_base_url = os.getenv('JUPYTERHUB_SERVICE_PREFIX') # /jupyterhub/user/{username}/ isJupyterLab = 'ServerApp' in os.environ.get('JUPYTERHUB_SINGLEUSER_APP','') # vs dashboard # if running in JupyterLab, need to add proxy prefix to base URL # e.g. /jupyterhub/user/{username}/proxy/{port}/ as expected by juptyer-server-proxy # if running as a dashboard, jhsingle-native-proxy will use the base URL as is if isJupyterLab: jupyterhub_base_url = f"{jupyterhub_base_url}proxy/{port}/" app = Dash( __name__, requests_pathname_prefix=jupyterhub_base_url, ) app.layout = html.Div('Hello World, from Dash') if __name__ == "__main__": app.run(host='0.0.0.0', port=port, debug=True)Test your dashboard: You will need the jupyter-server-proxy packaged installed to preview your dashboard in JupyterLab. Run the following command in the JupyterLab terminal to start your Dash dashboard:
BASHpython <path-to-dash-script>Then, in another browser tab, navigate to
<https://{xnat-url}/jupyterhub/user/{xnat-username}/proxy/8050/> to view your Dash dashboard (assuming you used the default port of 8050).Commit and push your script to a Git repository: Once you're satisfied with your dashboard, commit your script to a Git repository and push your changes. This repository should be accessible to your XNAT instance.
Configure your dashboard in XNAT: You will need the URL of your Git repository, the branch, and the path to the script within the repository to configure your dashboard in XNAT.
Dash dashboards can be previewed and tested in a separate browser tab.
Streamlit
Streamlit is an open-source Python library that allows you to create and share custom web apps for machine learning and data science. It enables the creation of interactive dashboards and applications from Python code.
To create a Streamlit dashboard, follow these steps:
Create a Python script in your Jupyter Environment: Your script should use the Streamlit API to create your dashboard. It's important to create and test your script within the Jupyter Environment where the dashboard will be deployed.
Test your dashboard: Although Streamlit does not have a preview widget in JupyterLab, you can still preview your dashboard if the jupyter-server-proxy package is installed within your Jupyter Environment. Run the following command in the JupyterLab terminal to start your Streamlit dashboard:
BASHstreamlit run <path-to-dashboard-script> --server.address=0.0.0.0 --server.port=8050Then, in another browser tab, navigate to
<https://<xnat-url>>/jupyterhub/user/{xnat-username}/proxy/8050/to view your Streamlit dashboard.Commit and push your script to a Git repository: Once you're satisfied with your dashboard, commit your script to a Git repository and push your changes. This repository should be accessible to your XNAT instance.
Configure your dashboard in XNAT: You will need the URL of your Git repository, the branch, and the path to the script within the repository to configure your dashboard in XNAT.
Streamlit dashboards can be previewed and tested in a separate browser tab.
To improve the user experience of Streamlit apps, checkout these Streamlit documentation pages:
Other
The dashboard feature is designed to be extensible and support any arbitrary web application. If you have a different dashboard framework or other data analysis tool that is proxyable with jhsingle-native-proxy (maybe R Shiny, or a Flask app), you can configure it to run in XNAT. See the Managing Dashboard Frameworks section for more details on how use jhsingle-native-proxy to run your own dashboards.
Dashboard Deployment
To deploy a dashboard you've created in XNAT, you will need to configure it in the JupyterHub plugin settings. Navigate to the 'Dashboards' tab in the JupyterHub plugin settings. Note that you will need admin privileges to access this page. This page will display all dashboards that have been configured in XNAT. From here, you can enable and disable dashboards at the site and project level. You can also create, edit, and delete dashboard configurations.
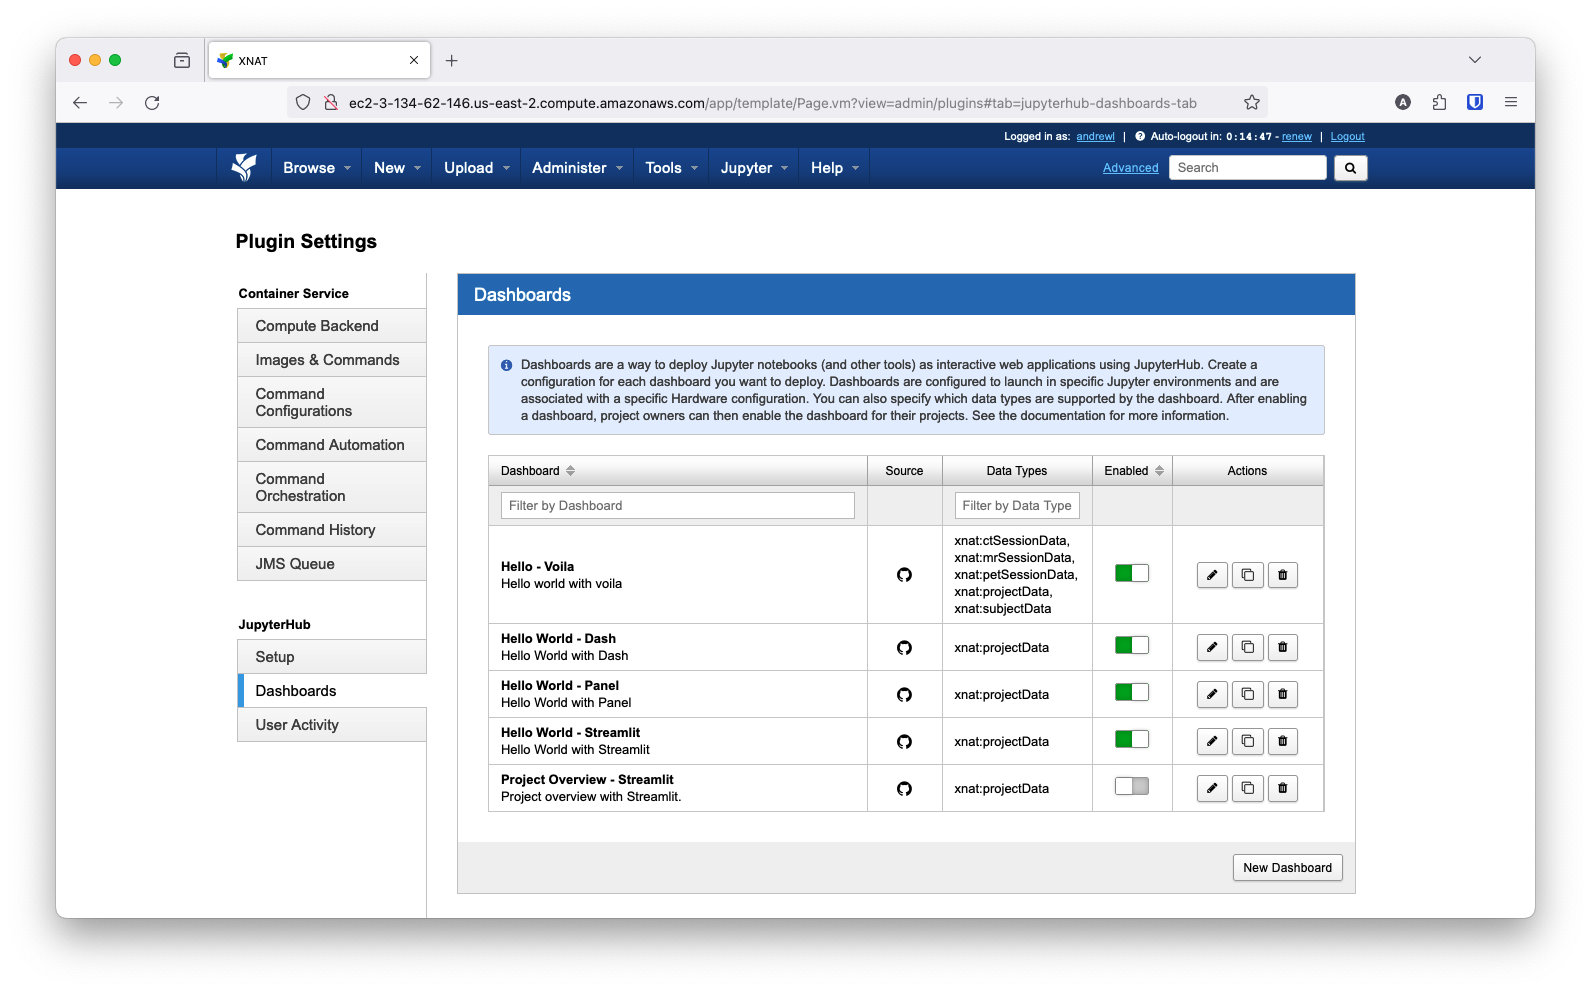
To view the list of dashboards configured in XNAT, navigate to the 'Dashboards' tab in the JupyterHub plugin settings.
Configuring Dashboards
To configure a dashboard for deployment in XNAT, click the 'New Dashboard' button. This will open a modal where you will need to provide the following information:
Name: The name of the dashboard. This will be displayed in the dashboard list.
Description: A description of the dashboard. This will be displayed to users when looking at the dashboard details.
Git Repo URL: The URL of the Git repository where the dashboard script is located.
Branch: The branch of the Git repository where the dashboard script is located.
Path: The path to the dashboard script within the Git repository.
Framework: The dashboard framework to use. This will determine how the dashboard is deployed.
Command: Only if using a custom dashboard framework. This will be passed to the Docker container that runs the dashboard. Use the jhsingle-native-proxy package to proxy the dashboard. See 'Managing Dashboard Frameworks' for more details.
Jupyter Environment: The Jupyter Environment to deploy the dashboard in. Note that the environment must have the required packages installed to run the dashboard.
Hardware: The Hardware requirements for the dashboard.
Data Types: The XNAT data types to enable for the dashboard. This will determine which data types the dashboard can be launched from.
It is also possible to copy an existing dashboard configuration by clicking the 'Copy' action. This will open a modal where you can configure the new dashboard.
Read and update the dashboard by clicking on the 'Edit' action (pencil icon). Delete the dashboard by clicking on the 'Delete' action (trash icon).
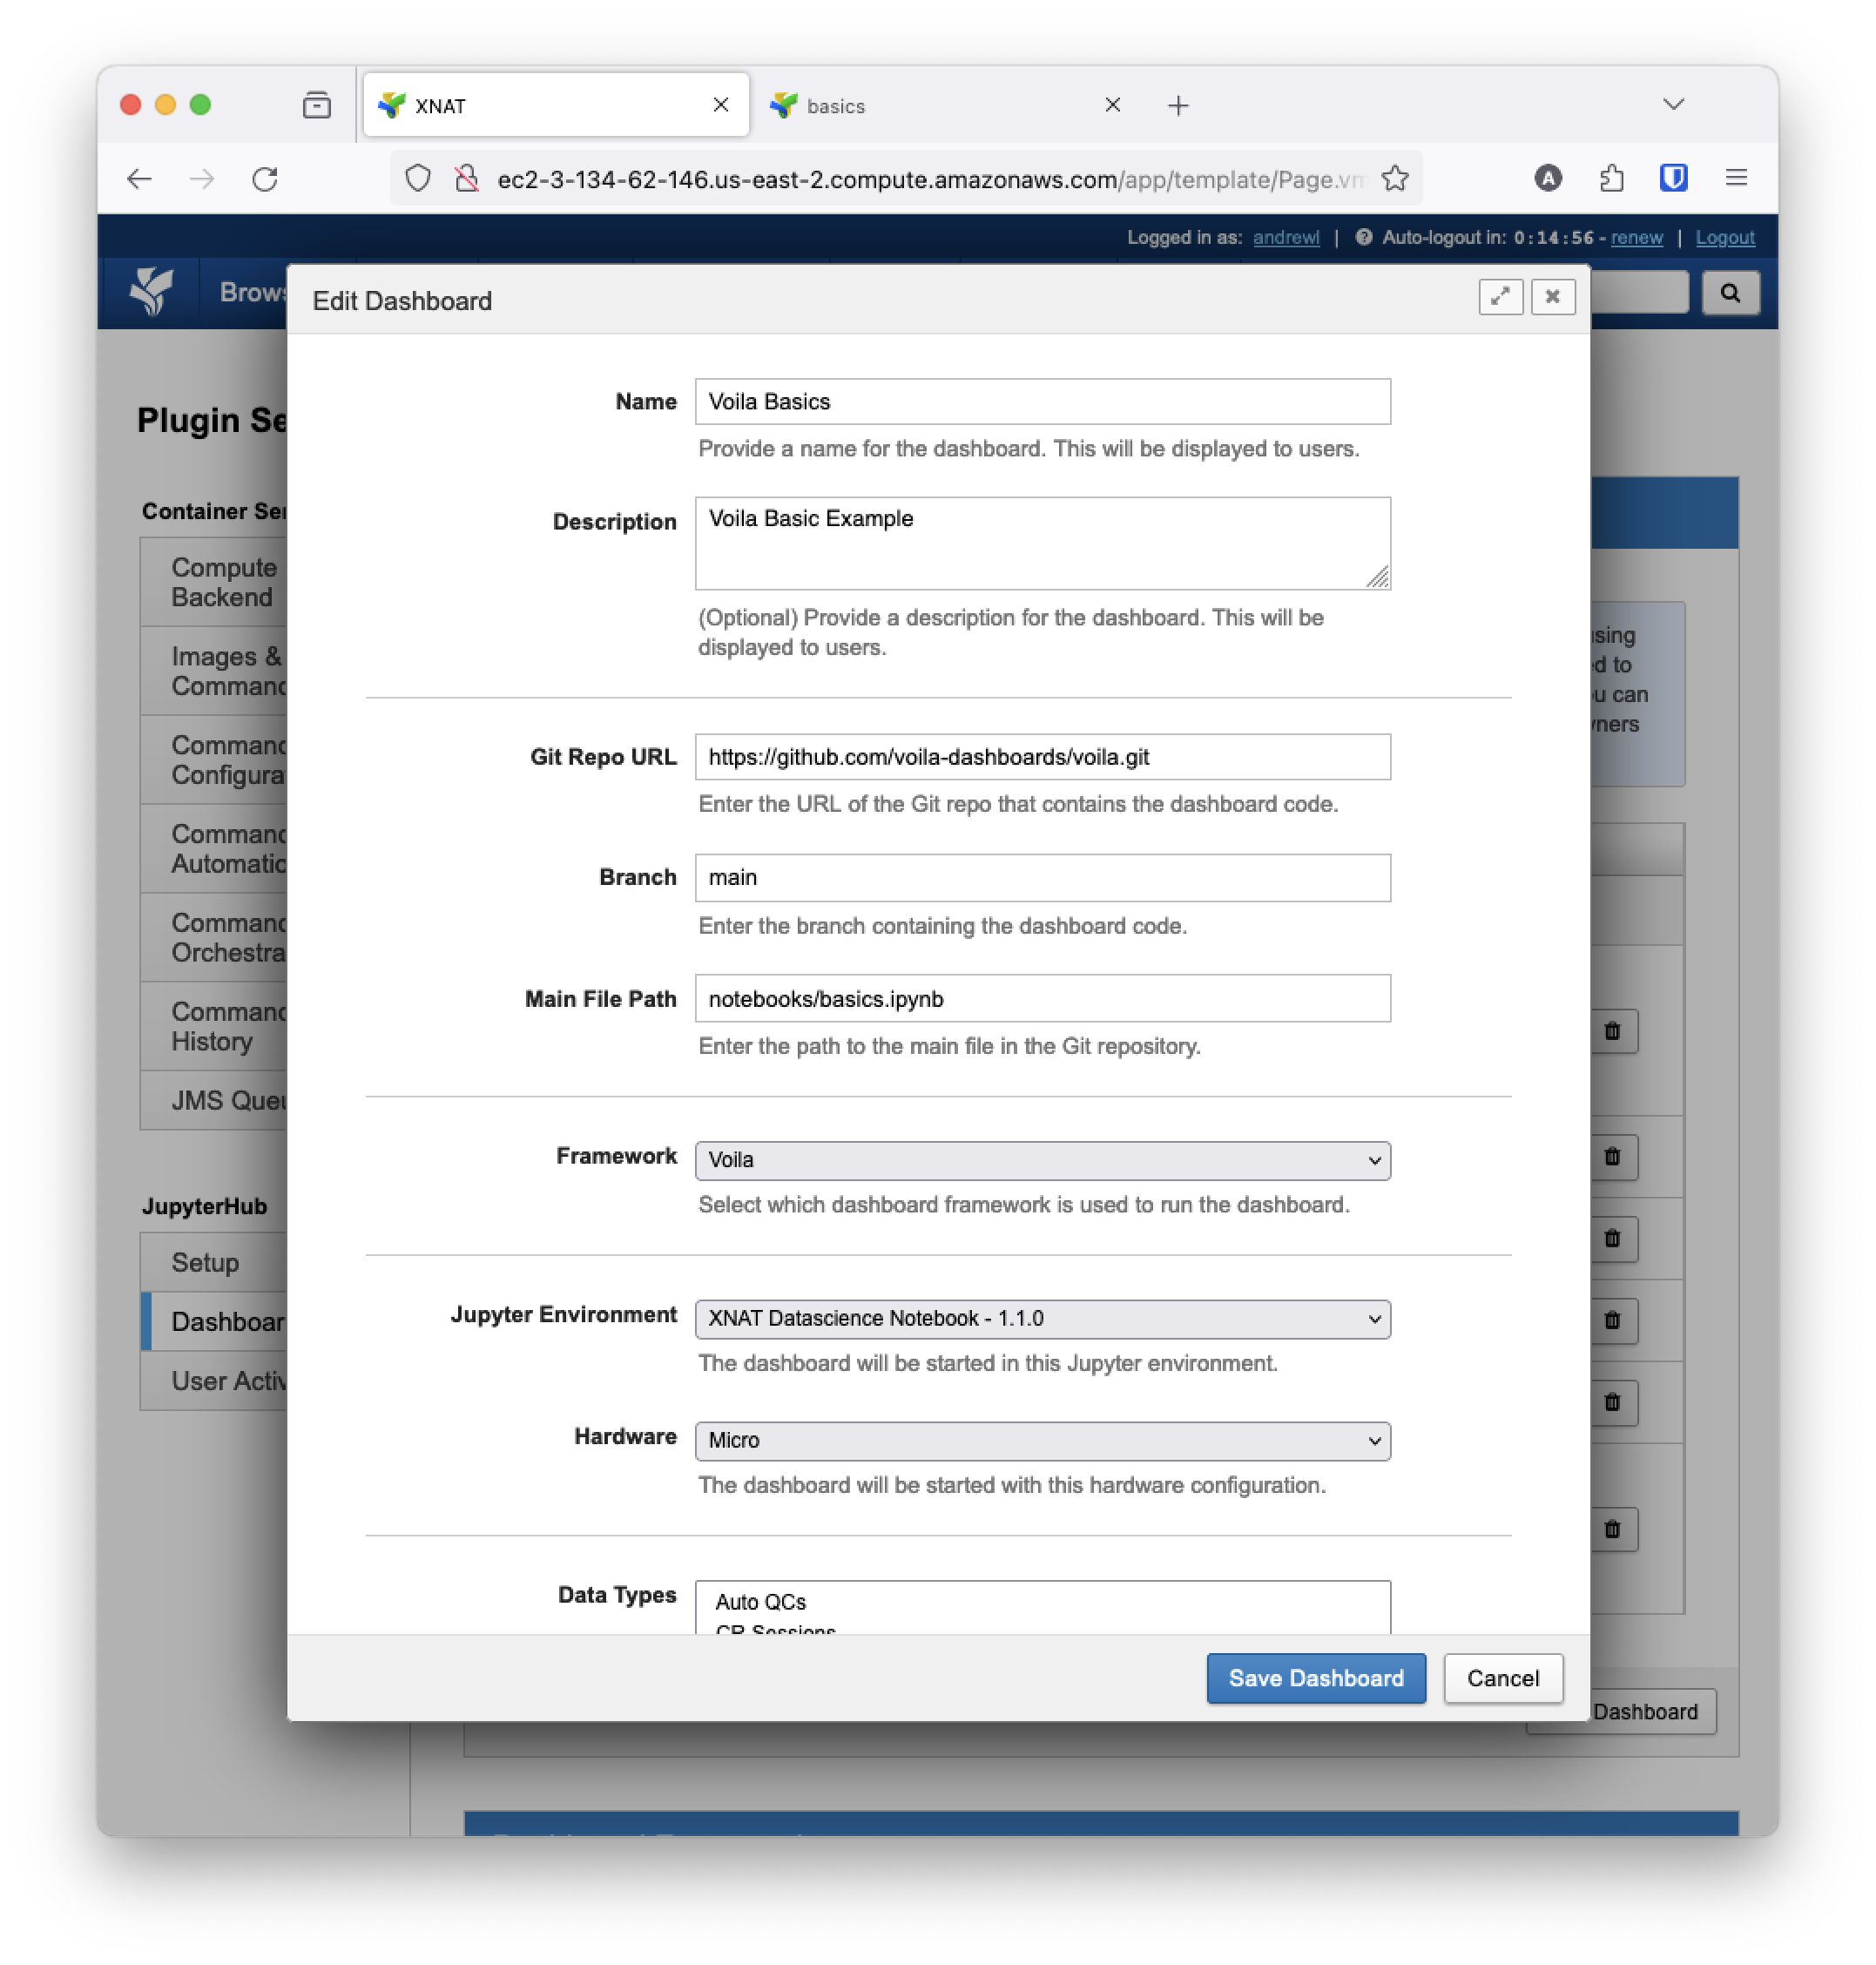
To configure a dashboard for deployment in XNAT, click the 'New Dashboard' button. This will open a modal where you will need to provide the dashboard details.
Enabling and Disabling Dashboards
To make a dashboard available:
Enable at the site level: Toggle the 'Enabled' switch in the Dashboards tab of the JupyterHub plugin settings.
Enable at the project level: Go to the project settings page, click the 'JupyterHub/Dashboards' tab, and toggle the dashboard's switch. If the dashboard is not enabled at the site level, it will not be available to enable at the project level.
After enabled at the site and project level, the dashboard will be available at the configured data types to all users with read access to the project.
To disable a dashboard:
Disable at the site level: Toggle the 'Enabled' switch in the Dashboards tab of the JupyterHub plugin settings.
Disable at the project level: Go to the project settings page, click the 'JupyterHub/Dashboards' tab, and toggle the dashboard's switch.
Remember, a dashboard must be enabled at both the site and project levels to be accessible to users. Note that users do not need to have the 'Jupyter' role to be able to use an enabled dashboard. This feature behaves similarly to the container service feature in XNAT.
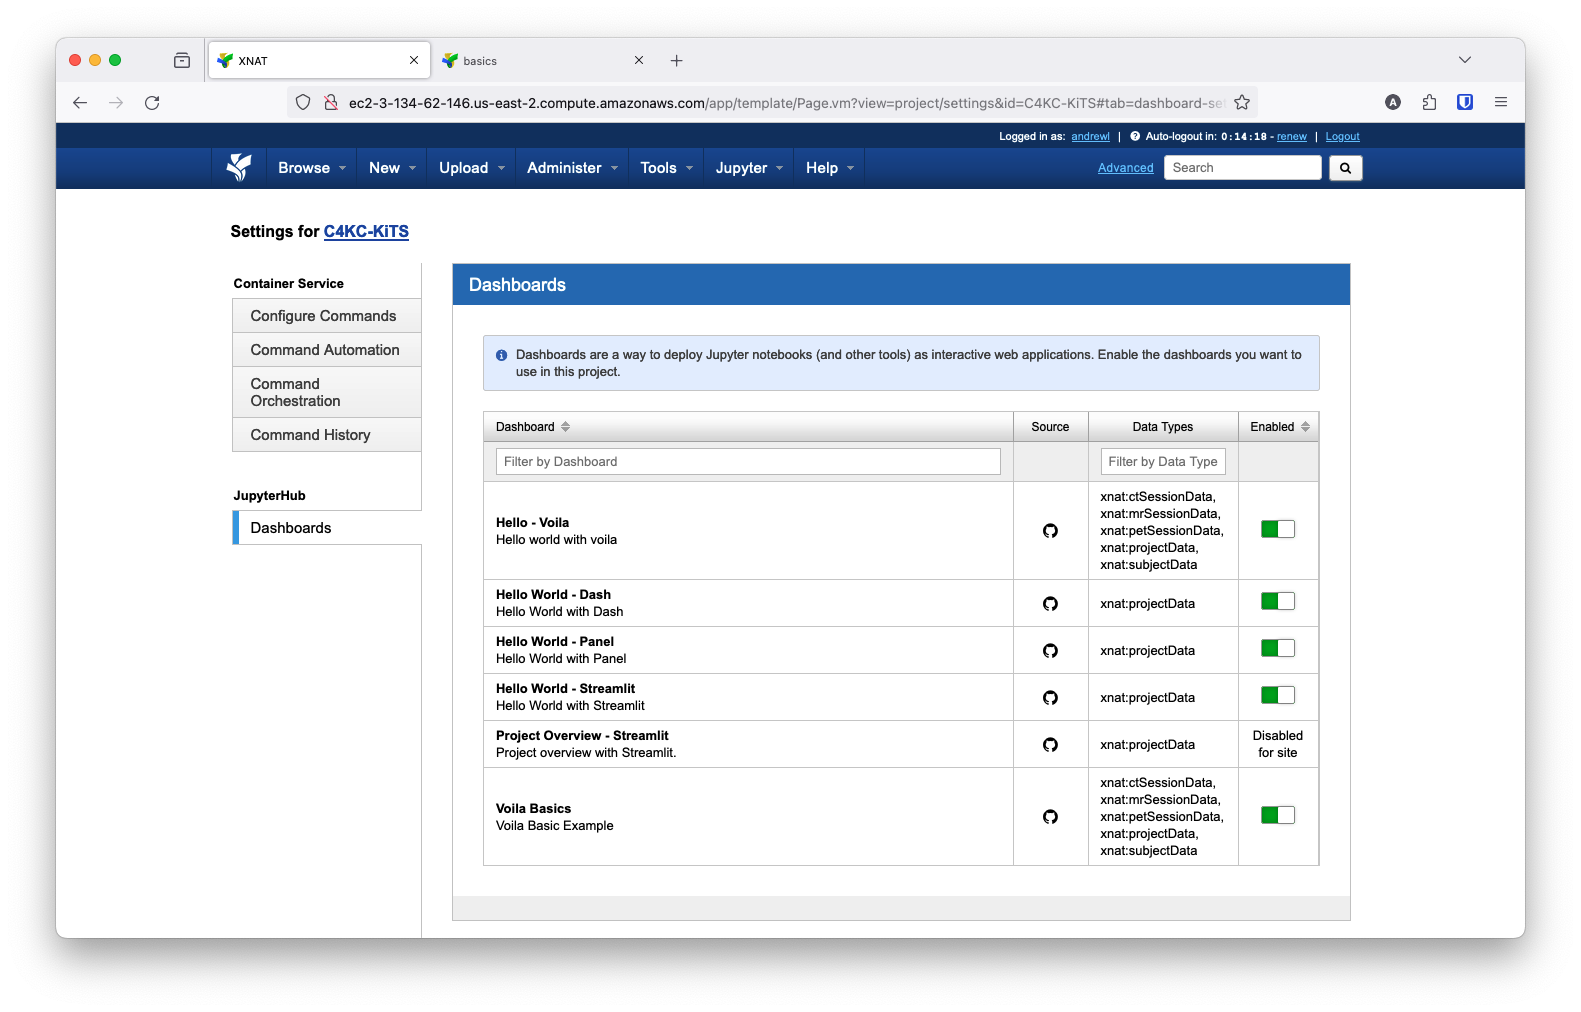
To enable or disable a dashboard for a project, navigate to the project settings page, click the 'JupyterHub/Dashboards' tab, and toggle the dashboard's switch.
Launching Dashboards
Once a dashboard has been configured and enabled (at both the site and project level), it will be accessible to users. To launch a dashboard, navigate to a data type that the dashboard is enabled for. You will see a Start Jupyter Dashboard option in the action bar. Clicking this option will open a prompt where you can select which dashboard to start. Select the dashboard you want to start, click Start Dashboard, and wait for JupyterHub to spin up the dashboard.
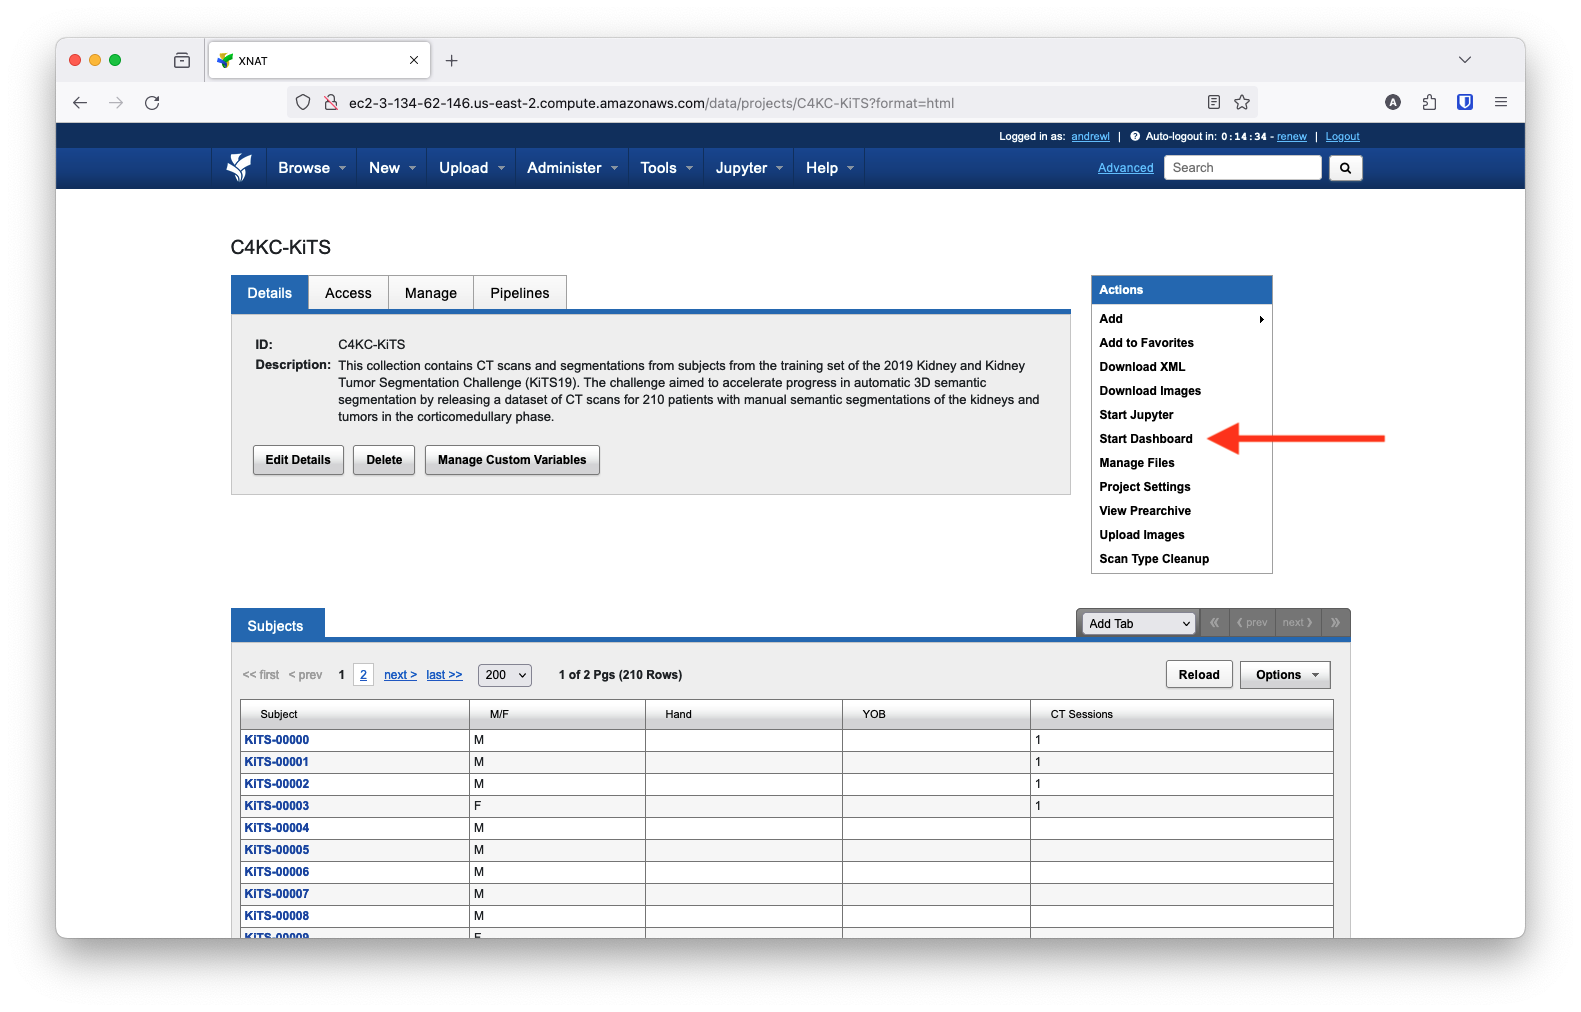
To launch a dashboard, navigate to a data type that the dashboard is enabled for. You will see a Start Jupyter Dashboard option in the actions box.
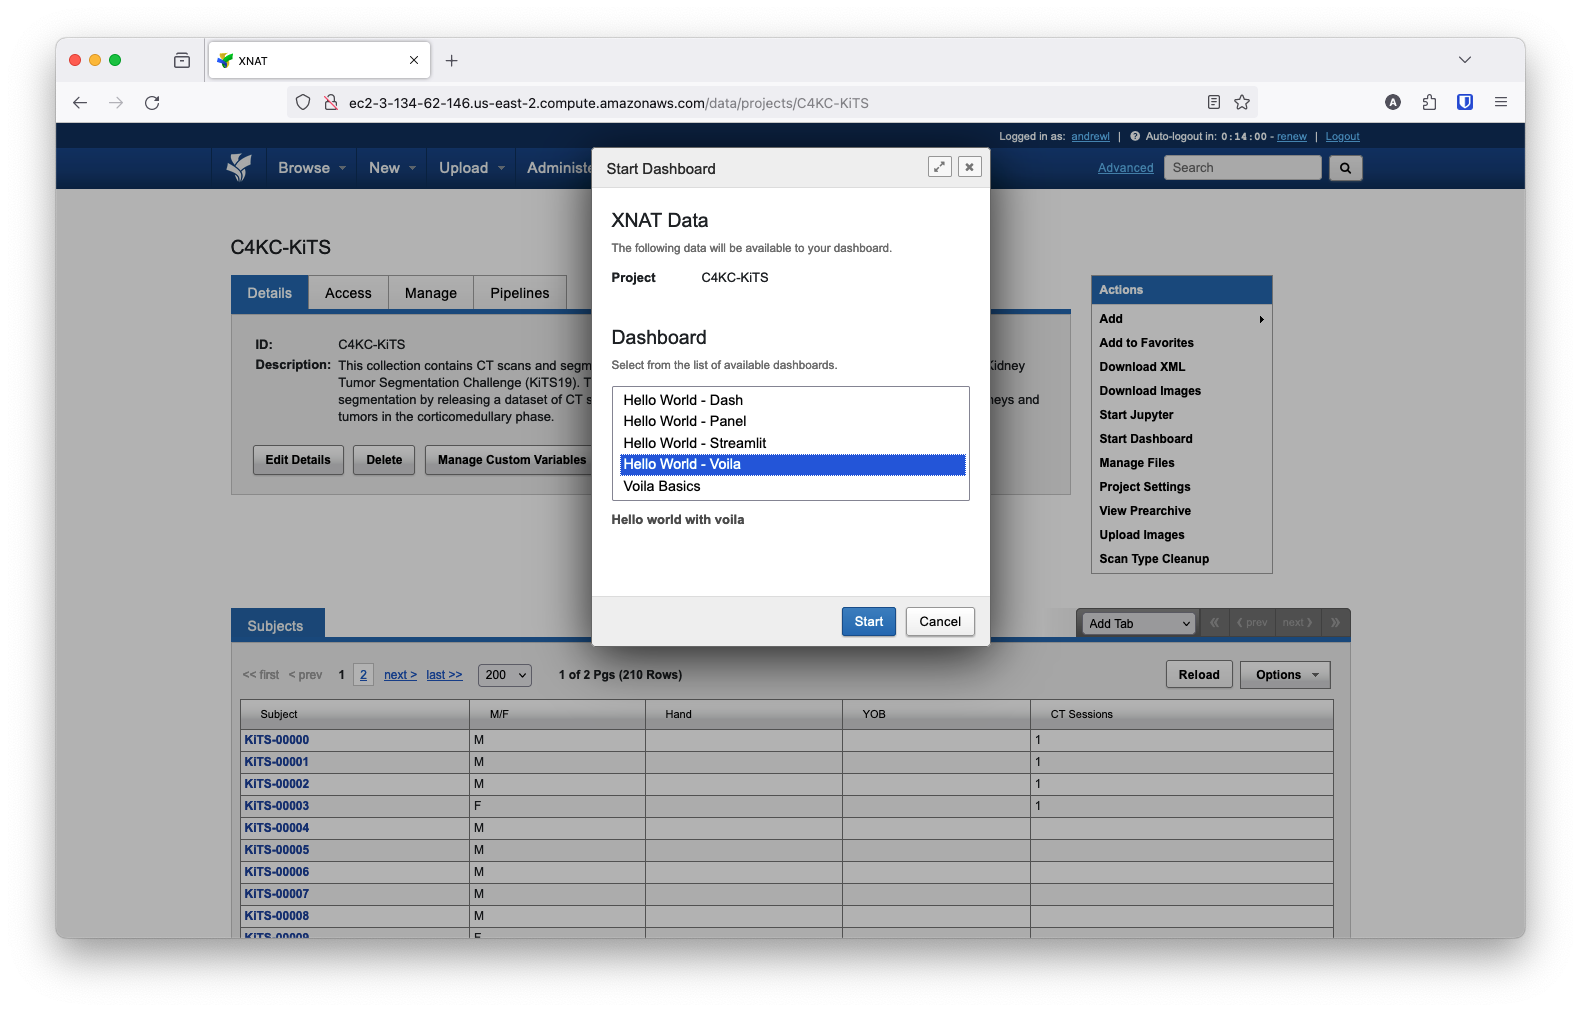
Clicking the Start Jupyter Dashboard option will open a prompt where you can select the dashboard to start.
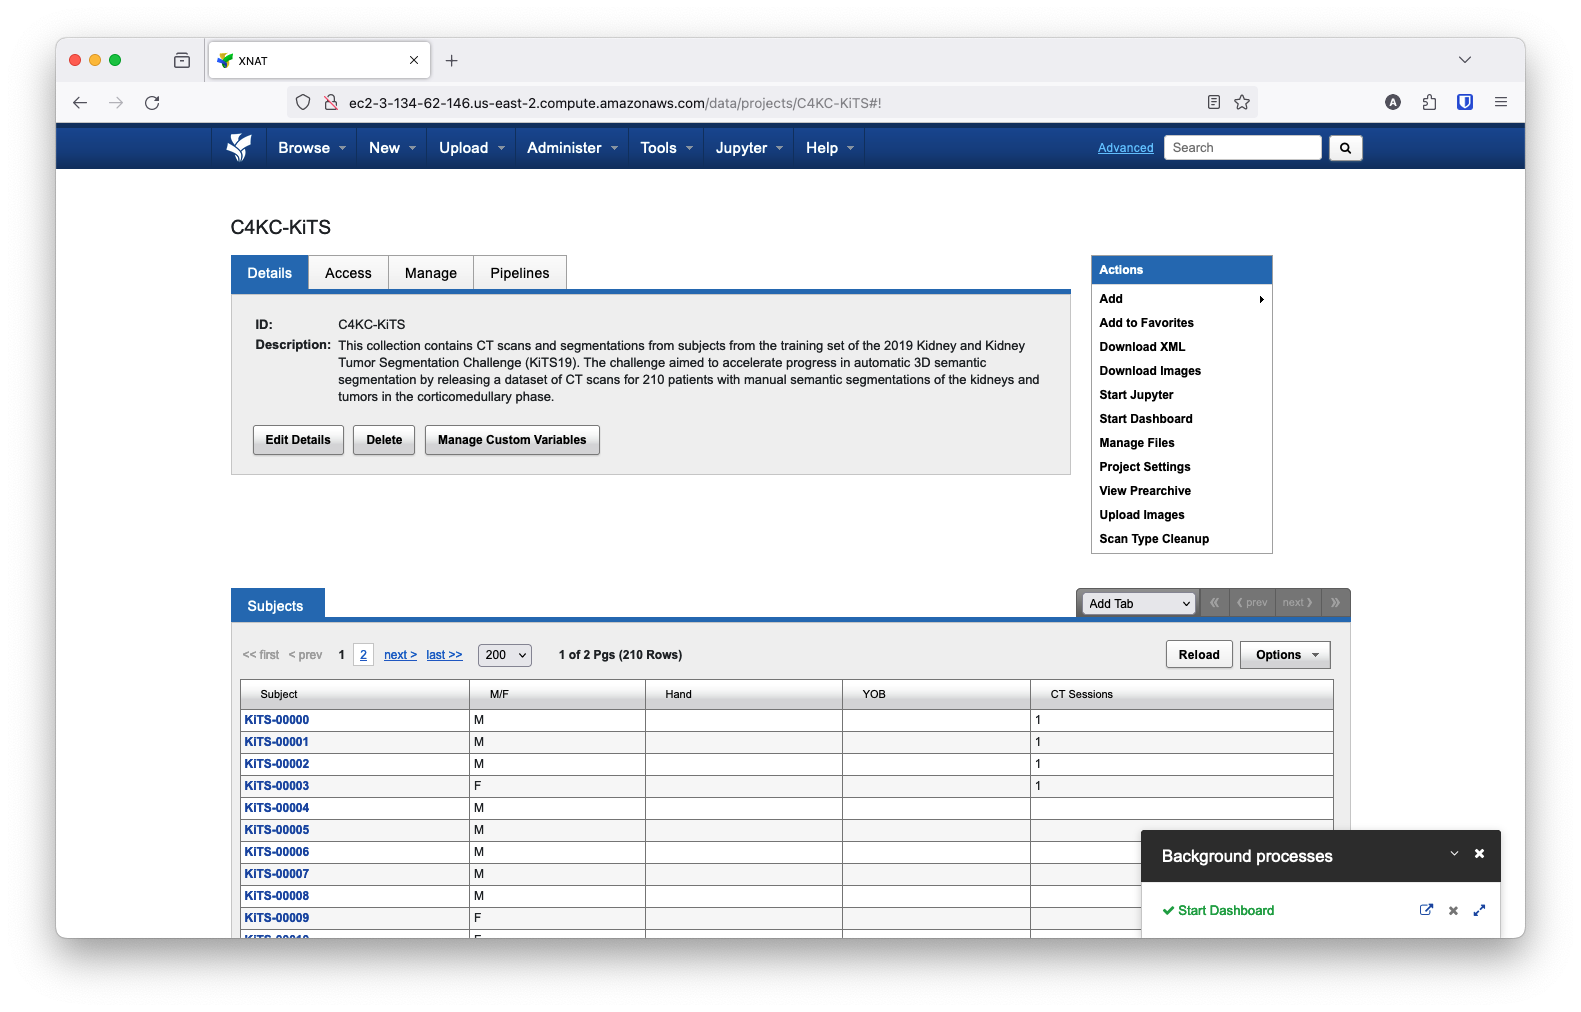
Once you've started a dashboard, you will see a background process for starting the dashboard. When ready, you can click the external link button to open the dashboard in a new tab.
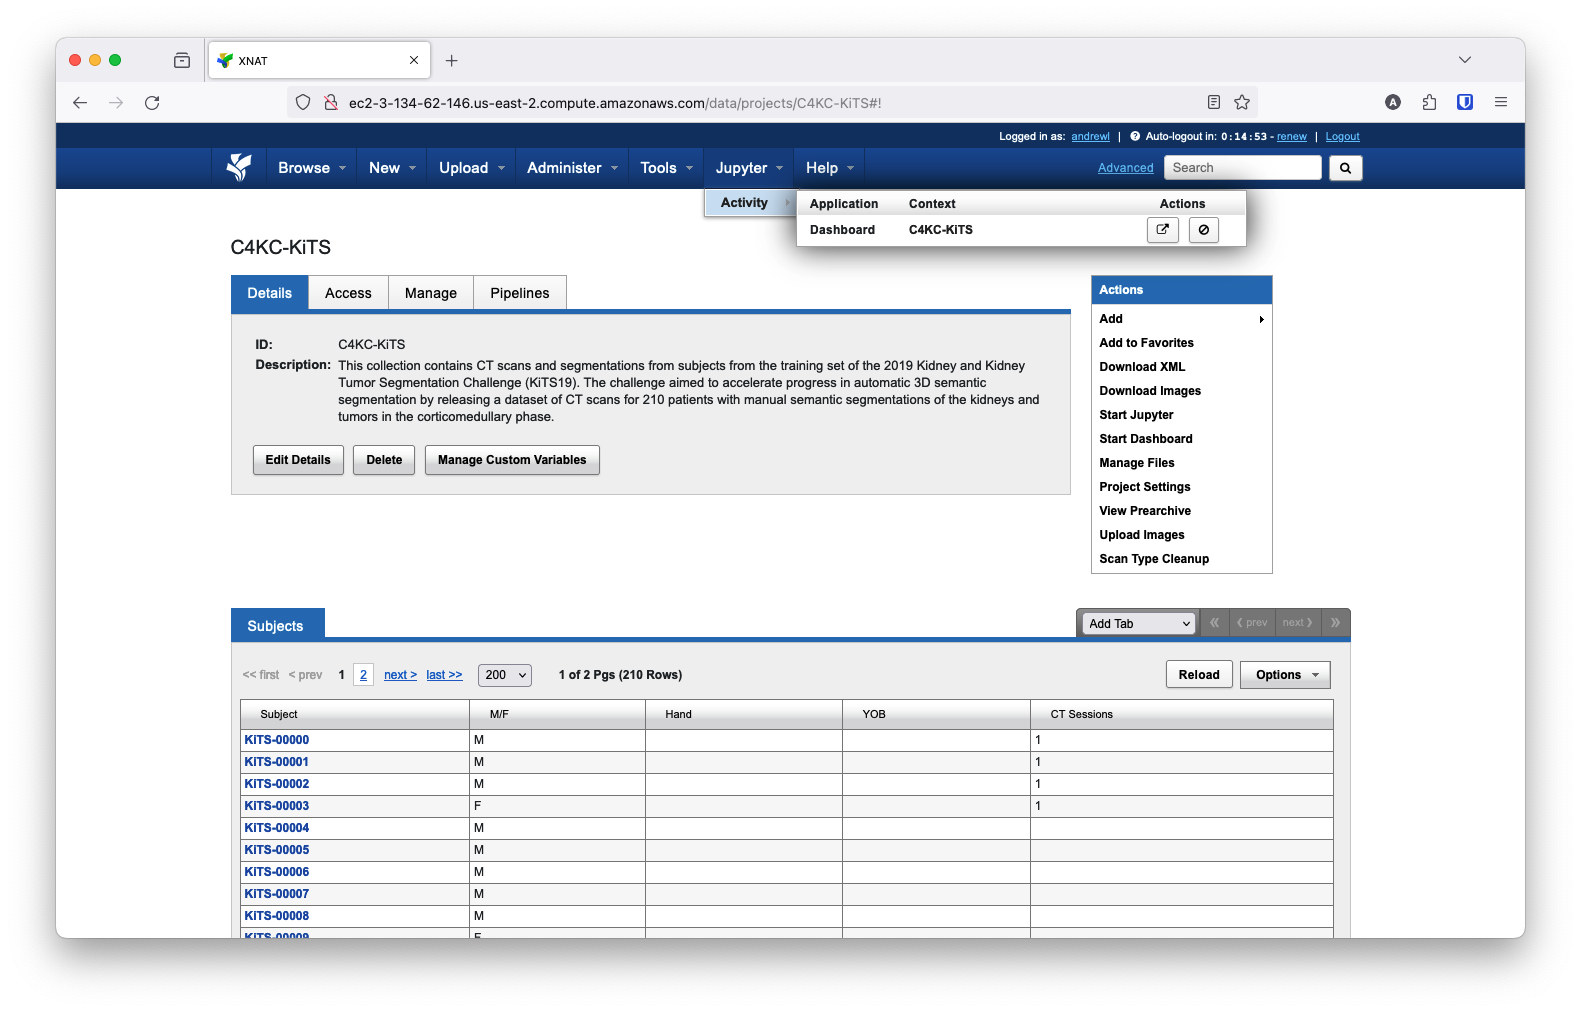
You can access a running dashboard from the 'Activity' tab in the Jupyter menu.

Starting a dashboard.
Stopping Dashboards
To stop a dashboard, from the navigation menu, go to 'Jupyter > Activity'. This will display all running dashboards and notebook servers. Click the 'Stop' action to stop the dashboard.
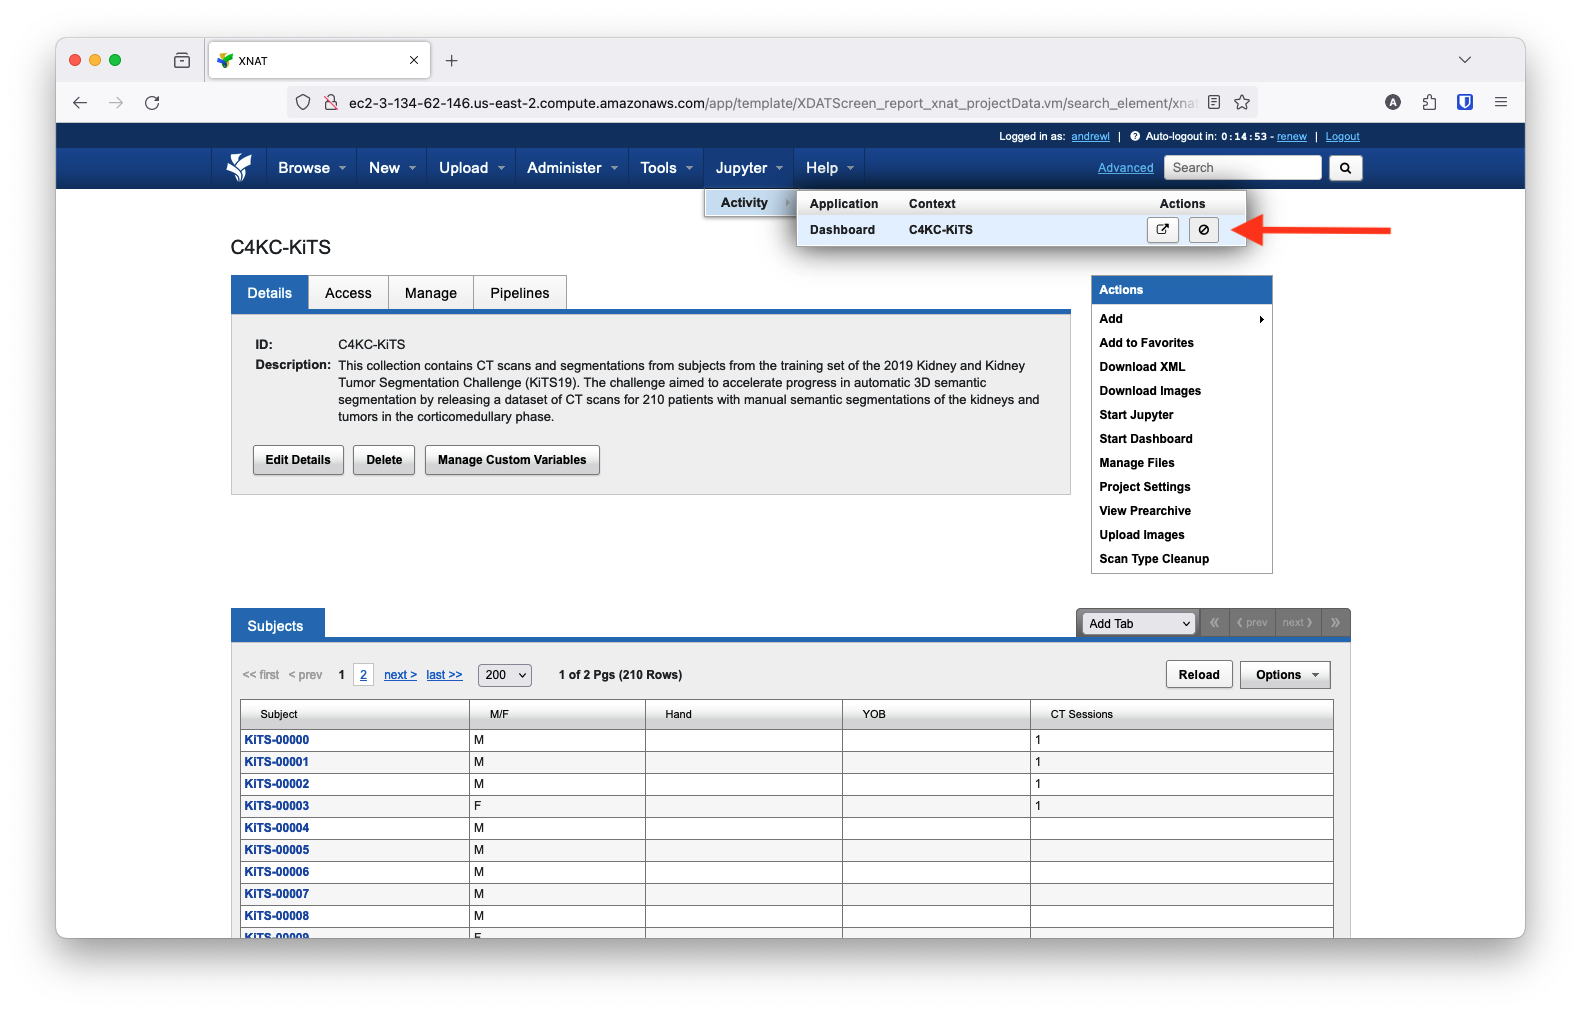
To stop a dashboard, from the navigation menu, go to 'Jupyter > Activity' and click the 'Stop' action.
Stopping a dashboard.
Troubleshooting
There are a few different ways to troubleshoot dashboards:
Check the container logs: The container logs may contain useful information about why the dashboard failed to start.
Check the docker ps output: The
docker service ps --no-trunc SERVICEcommand output will show you the status of the dashboard container. If the container is not being scheduled, this may show you why.Check the JupyterHub logs: The JupyterHub logs may contain useful information about why the dashboard failed to start.
Docker exec into the container: You can use the
docker exec -it <container-id> /bin/bashcommand to exec into the dashboard container. This will allow you to run commands within the container and see what's going on.Check the browser console: If your dashboard is starting but not displaying correctly, the browser console and network tabs may contain useful information about why.
Managing Dashboard Frameworks
The plugin is pre-configured to support the following dashboard frameworks:
Each framework has a corresponding command template stored in the plugin. This template is used to generate the command that is passed to the Docker container running the dashboard. You can edit these command templates to add additional arguments, change the default port, etc. You can also add new frameworks as needed.
To manage the dashboard frameworks, navigate to the 'Dashboard' tab in the JupyterHub plugin settings. Under the 'Dashboard Frameworks' section, you will see a list of the pre-configured frameworks.
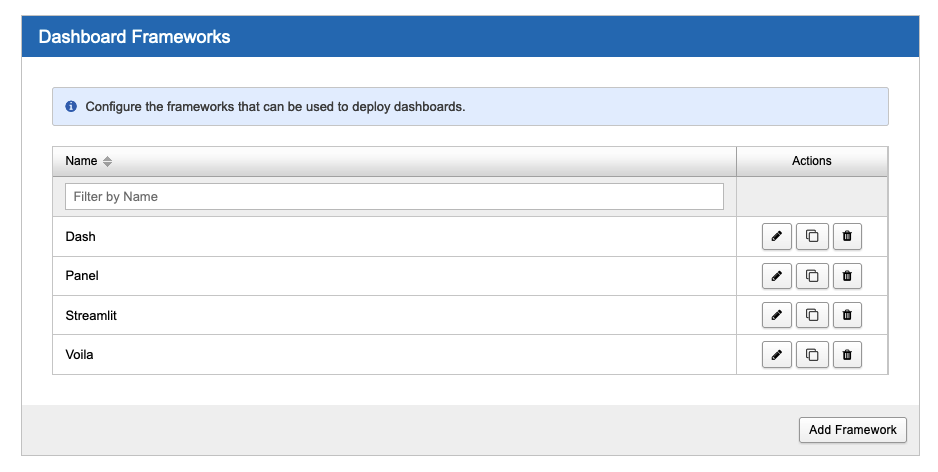
View the list of dashboard frameworks in the JupyterHub/Dashboard tab of the plugin settings.
To add a new dashboard framework, click the 'Add Framework' button. This will open a modal where you can configure the framework. You will need to provide:
Name: The name of the framework. This will be displayed in the framework list.
Command Template: The command template to use when running the dashboard. This will be used to generate the command
that is passed to the Docker container that runs the dashboard.
The command template accepts the following placeholders:
{repo}: The URL of the Git repository where the dashboard script is located.
{repobranch}: The branch of the Git repository where the dashboard script is located.
{mainFilePath}: The path to the dashboard script within the Git repository.
Ensure you use the jhsingle-native-proxy package to start and proxy the dashboard through JupyterHub. For more details on how to use this package and everything it supports, refer to the
jhsingle-native-proxy documentation.
For instance, the command template for Voilà is:
jhsingle-native-proxy --port 8888 --destport 0
                      --repo {repo}
                      --repobranch {repobranch}
                      --repofolder /home/jovyan/dashboards
                      voila /home/jovyan/dashboards/{mainFilePath}
                        {--}port {port} {--}no-browser
                        {--}Voila.base_url={base_url}/
                        {--}Voila.server_url=/
                        {--}Voila.ip=0.0.0.0
                        {--}Voila.tornado_settings
                        allow_origin={origin_host} --progressive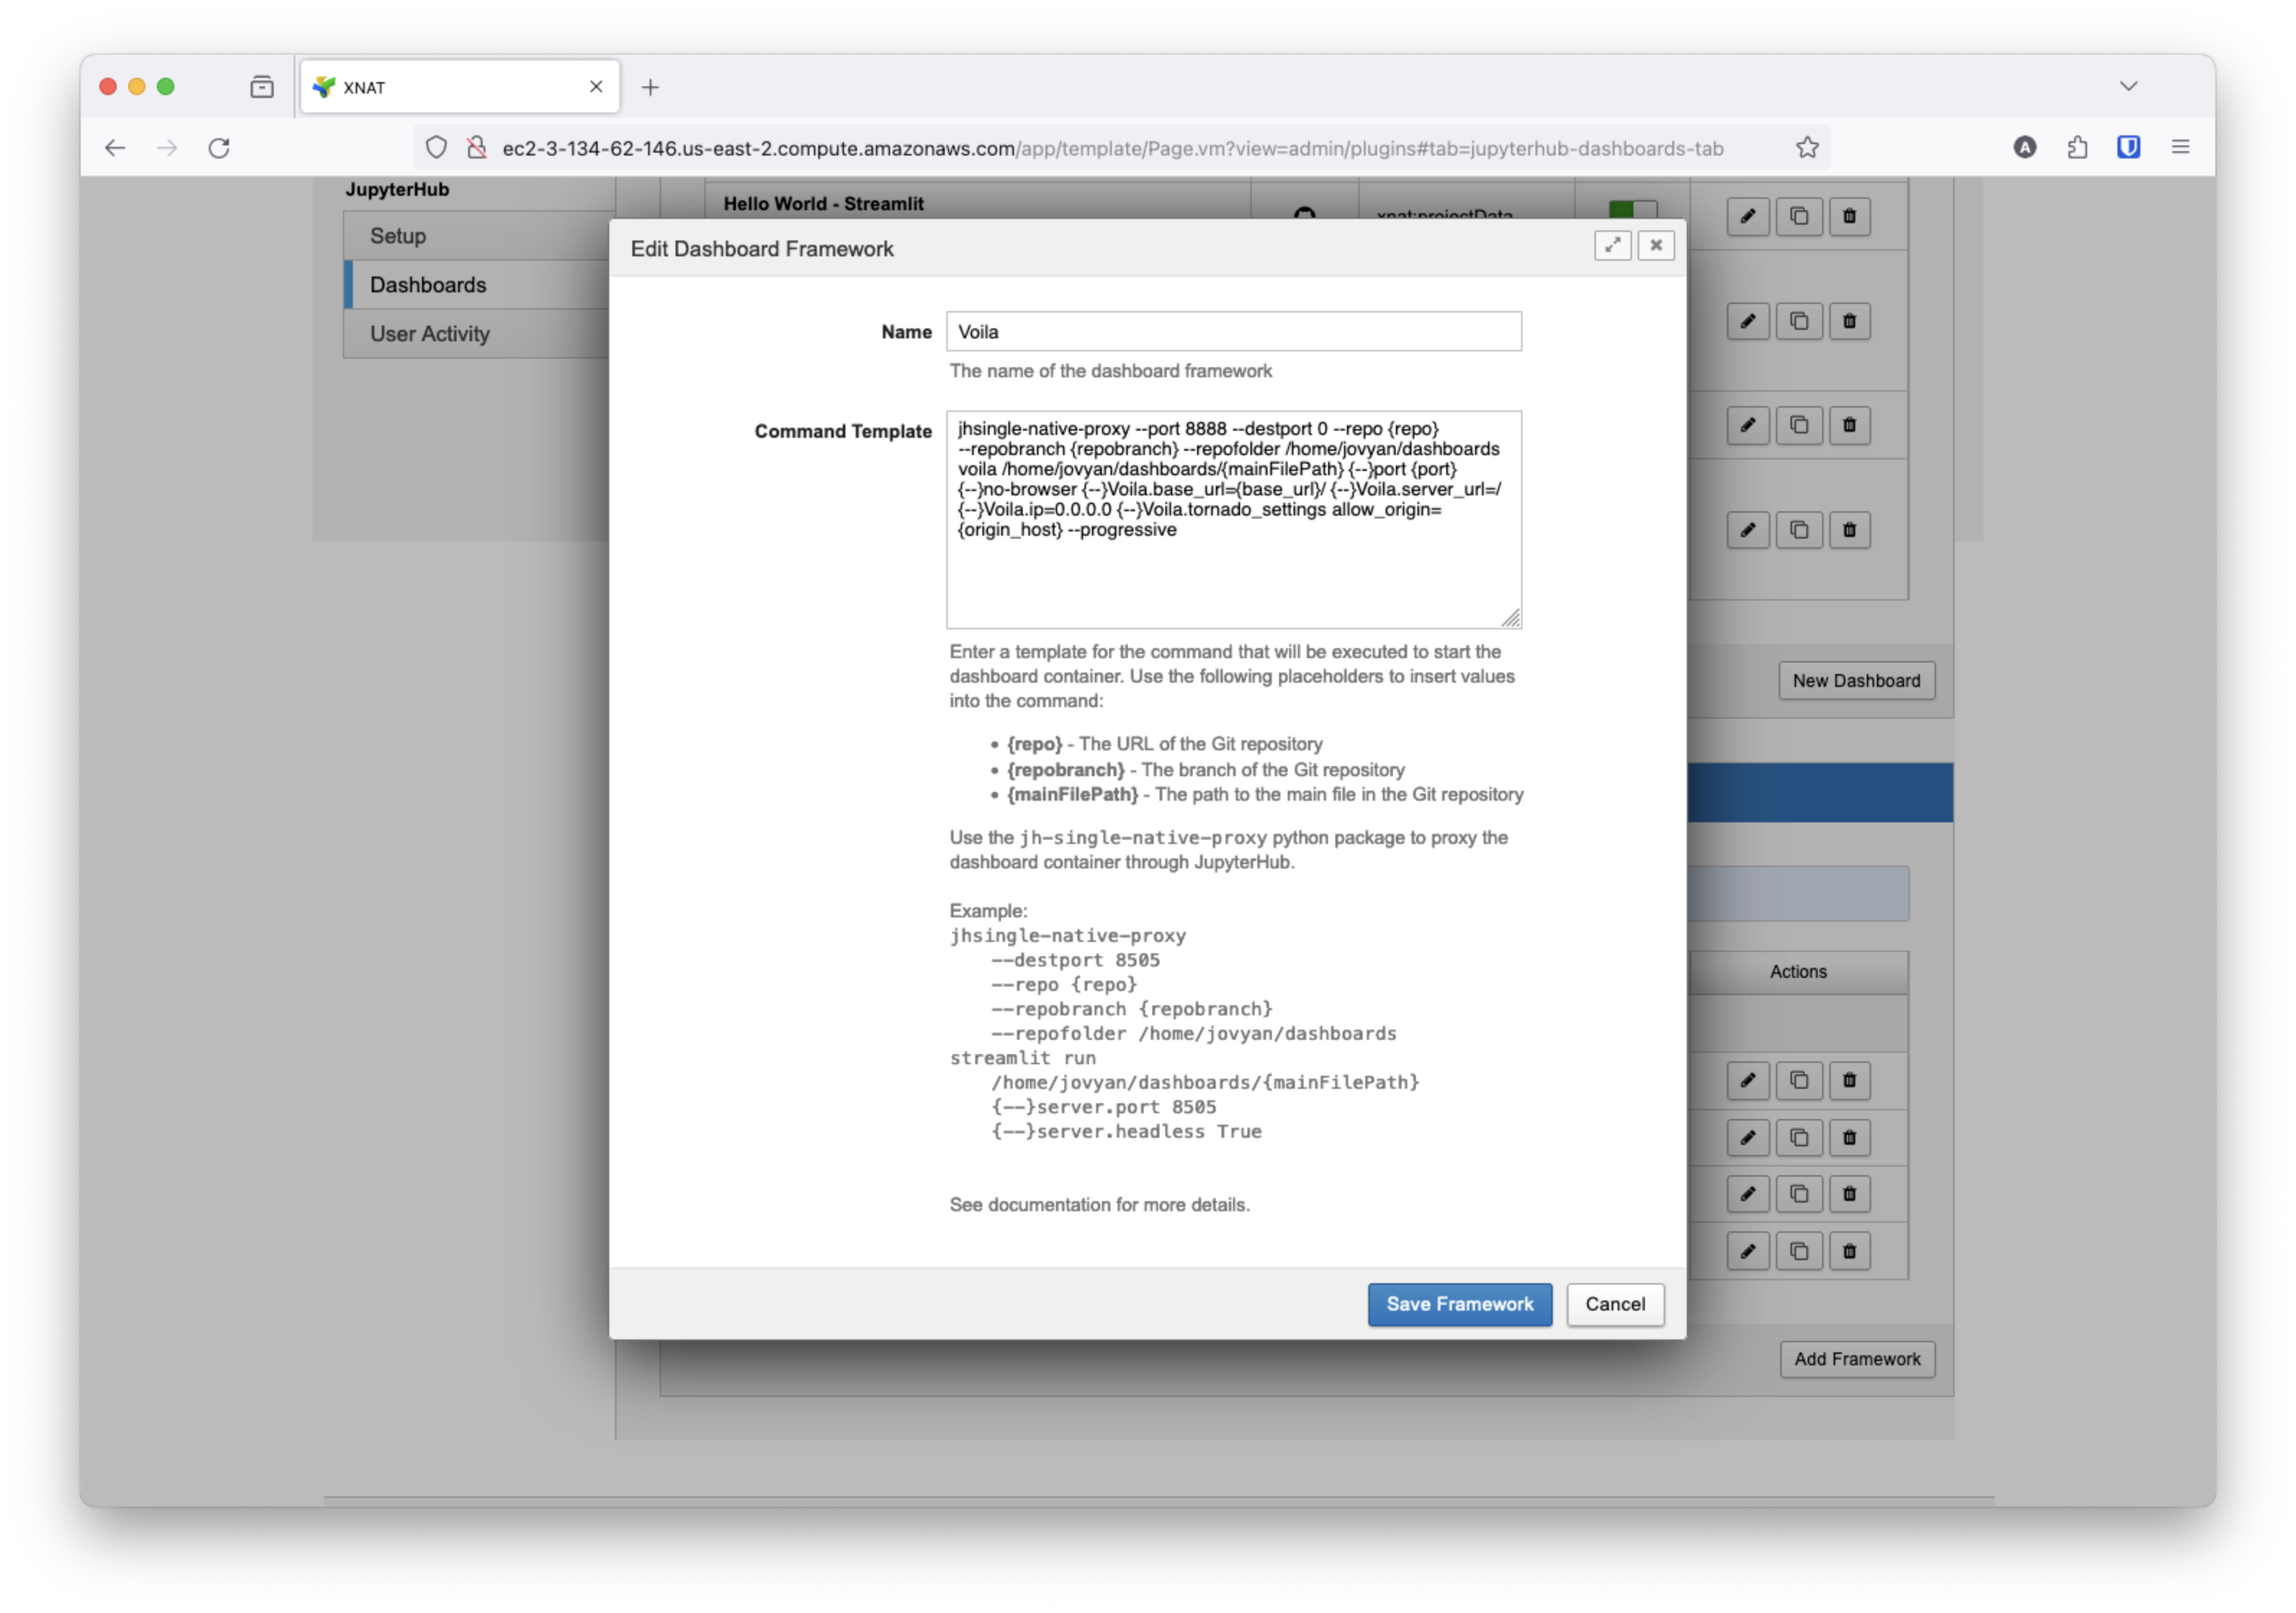
Configure a dashboard frameworks command template.
How It Works
The dashboard feature of the XNAT JupyterHub integration leverages the jhsingle-native-proxy package to proxy dashboards through JupyterHub. This open-source package was developed for JupyterHub-deployed dashboards. It wraps an arbitrary web application in place of running JupyterLab. OAuth authentication is enforced based on JUPYTERHUB_* environment variables. JupyterHub will launch a Docker container running the jhsingle-native-proxy package and pass it the command to start the dashboard instead of starting JupyterLab. It will then proxy the dashboard through JupyterHub. When the container starts, jhsingle-native-proxy will also pull the specified Git repository and checkout the specified branch (though you can configure a custom command to do something different).
Example Dashboards
Some simple example dashboards are available in the xnat-jupyter-notebooks repository. These dashboards are configured to run in the xnat/datascience-notebook:1.1.0 Docker image. You can use these dashboards to test the dashboard feature in XNAT.